

SEND Education Transport, Inequalities, Exclusions & Projections
SEND Education Transport
Please note: the full report can be downloaded via the link at the bottom of the SEND Executive Summary section.
Central Bedfordshire Council considers transport an extension of the school day to ensure the children and young people arrive at school or college ready to learn. Wherever possible, and where procurement rules allow, children and young people remain on the same transport with the same driver and passenger assistant, where applicable. Transport is provided in line with Central Bedfordshire Council’s Home to School Transport policies Apply for school transport | Central Bedfordshire Council (accessed 17/10/2025).
In 2024/25 Central Bedfordshire Council provided home-to-school transport for 1,105 young people (including 79 students aged 16 years and over) on 321 routes, all of whom have an EHC plan. 287 were transported by the Council’s own Fleet and Non-Emergency Patient Transport services, an increase from 192 in 2023/24 that has required additional vehicles and staff. Other pupils are transported by private operators whose staff are trained and vetted to the same level as Central Bedfordshire Council employees.
153 young people were provided with single transport, mostly because the young person was the only one attending a particular establishment or sometimes due to the student’s needs. Further, 136 young people are funded through a Personal Transport Budget or the payment of parental mileage.
Inequalities
Inequalities can affect the education, health and well-being of children and young people of all ages. These are covered in the Children and Young People section[1] of the Central Bedfordshire JSNA but they can impact on children with SEND even more, as explored in the following sections on Free School Meals, Ethnicity and Suspensions and Exclusions.
Free School Meals
Across England, pupils with an EHC plan or requiring SEN support are more likely to be eligible for free school meals (FSM) compared to all pupils and to those without special educational needs. In Central Bedfordshire in 2024/25:
- 31.8% (n=977) of pupils with an EHC plan were eligible for free school meals, a lower value compared to the East of England region (38.7%) and England (43.8%) averages
- 25.4% (n=1,440) of local pupils with SEN Support were eligible for free school meals, a lower value compared to the East of England (33.9%) and England (39.3%) averages
Recent local trends in Figure 15 also illustrate how the overall increase in the percentage of pupils eligible for free school meals (‘Total’ line) continues to mirror the overall increase in the percentages of eligible SEND children. The gap between those local pupils eligible for free school meals with an EHC plan or receiving SEN support also remains large but lower than the gaps at regional and national levels.
Further, Figure 16 below illustrates the variation in the relationship between eligibility for free school meals and primary need, although there is no data available for those with Severe Learning Difficulties receiving SEN support.
Figure 15: Trend in pupils (as a %) by type of SEN Support in Central Bedfordshire eligible for free school meals
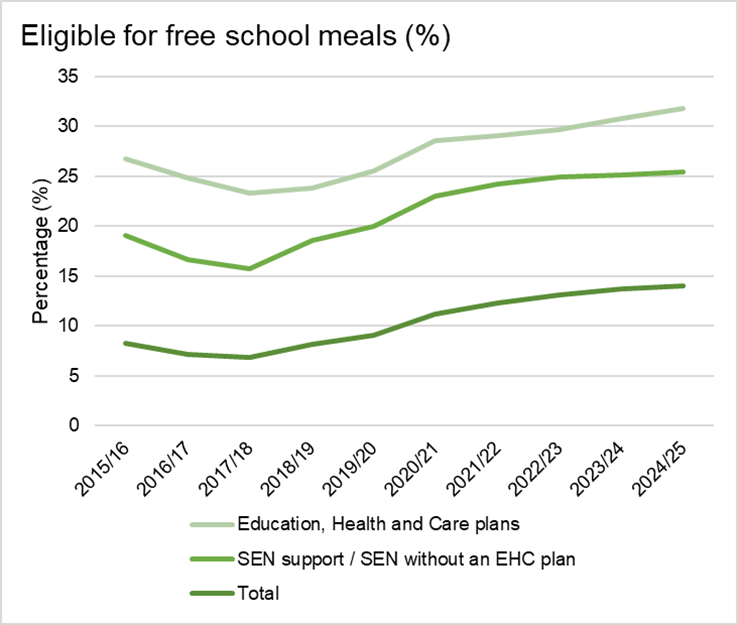
Figure 16: Free school meal take up by primary need for SEND pupils in Central Bedfordshire state funded schools in 2024/25
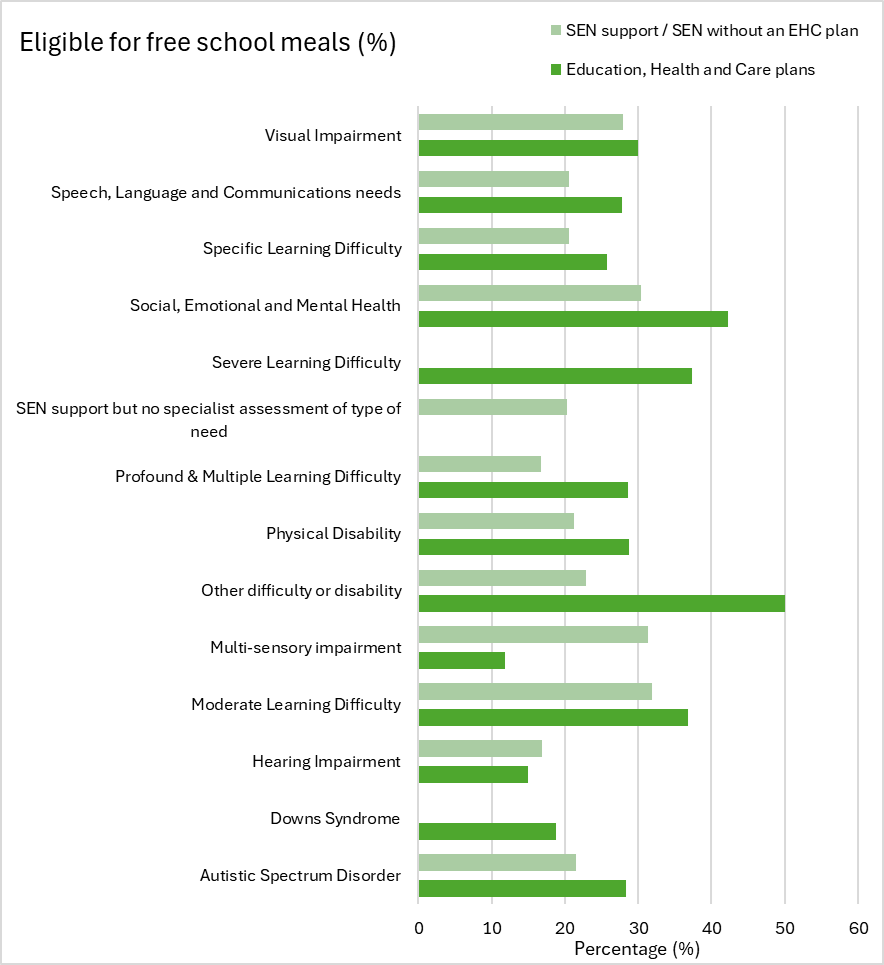
In Central Bedfordshire for 2024/25 free school meals eligibility was highest for pupils with the following primary needs, with a similar distribution seen at regional and national levels[2]:
- Social, Emotional and Mental Health (n= 804)
- Autistic Spectrum Disorder (n = 437)
- Moderate Learning Difficulties (n= 356)
- Speech, Language and Communications Needs (n=301)
- Specific Learning Difficulty (n= 255)
Ethnicity
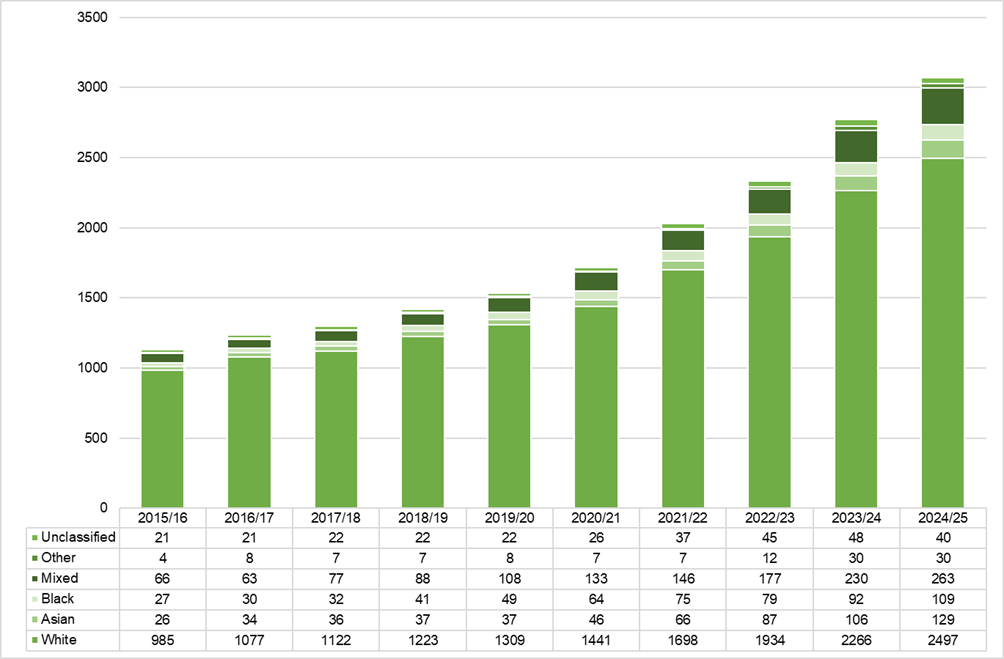
Central Bedfordshire has experienced an increase in numbers of pupils on EHC Plans across all ethnic backgrounds in recent years, as summarised in Figure 17 below. Whilst children and young people from White backgrounds continue to make up the majority, as a proportion they have decreased from 87% in 2015-17 to 81% in 2024/25. During this period the proportion of pupils from Black backgrounds has remained relatively constant (3-4%) but the proportions of pupils from Asian and Mixed backgrounds continue to rise steadily:
- Asian backgrounds – from 2% in 2015/16 to 4% of pupils in 2024/25
- Mixed backgrounds – from 6% in 2015/16 to 9% of pupil in 2024/25
Figure 17: Trend in ethnicity for pupils on EHC Plan in Central Bedfordshire state-funded schools, 2015/16-2024/25
Central Bedfordshire has also experienced an increase in the numbers of pupils requiring SEN support across all ethnic backgrounds in recent years, though this is more gradual than for EHC Plan pupils and this is summarised in Figure 18 below. Whilst children and young people from White backgrounds continue to make up the majority, as a proportion they have decreased from 89% in 2015/17 to 85% in the 2024/25 data. The proportion of pupils from Mixed backgrounds has also increased steadily during this period, from 5.7% in 2015/16 to 8.3% in 2024/25. However, the proportion of pupils from Black and Asian backgrounds requiring SEN support has remained relatively constant:
- Black backgrounds from 2.6% in 2015/16 to 2.5% in 2024/25
- Asian backgrounds from 1.5% in 2015/16 to 2.3% in 2024/25
Figure 18: Trend in ethnicity for pupils receiving SEN support in Central Bedfordshire state-funded schools, 2015/16-2024/25
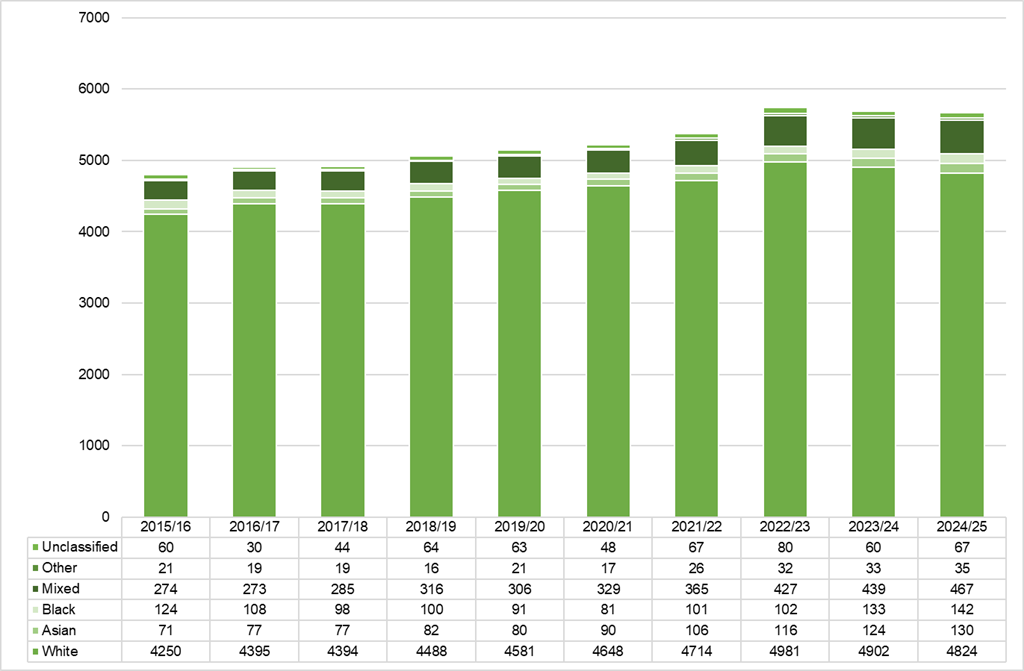
Table 15 explores how ethnicity is reflected across the different primary needs in the most recent data. For those local children and young people on EHC Plans, whilst the numbers for many primary needs are relatively small, notable observations when compared to the proportions in Figure 17 include:
- A higher proportion of White pupils (88%) with Specific Learning Difficulty
- A slightly higher proportion of Asian pupils (5%) with Autistic Spectrum Condition
- A slightly higher proportion of Black pupils (6%) with Speech, Language and Communication needs
- A slightly higher proportion of Mixed race pupils (11%) with Social, Emotional and Mental Health Needs
Table 15: Primary need by ethnicity for children and young people by SEN provision in Central Bedfordshire in 2024/25
| Primary need | EHC plans | SEN Support | ||||||||||
| White | Asian | Black | Mixed | Other | Unclassified | White | Asian | Black | Mixed | Other | Unclassified | |
| Autistic Spectrum Disorder | 848 (79%) | 59 (5%) | 35 (3%) | 100 (9%) | 18 (2%) | 13 (1%) | 533 (87%) | 8 (1%) | 6 (1%) | 60 (10%) | 4 (1%) | 2 (1%) |
| Downs Syndrome | 13 (81%) | 1 (6%) | 1 (6%) | 1 (6%) | 0 (0%) | 0 (0%) | 1 (50%) | 0 (0%) | 0 (0%) | 1 (50%) | 0 (0%) | 0 (3%) |
| Hearing Impairment | 33 (83%) | 1 (3%) | 3 (8%) | 3 (8%) | 0 (0%) | 0 (0%) | 69 (90%) | 3 (4%) | 1 (1%) | 2 (3%) | 1 (1%) | 1 (1%) |
| Moderate Learning Difficulty | 205 (86%) | 4 (2%) | 7 (3%) | 18 (8%) | 1 (0%) | 4 (2%) | 717 (85%) | 30 (4%) | 14 (2%) | 61 (7%) | 5 (1%) | 13 (5%) |
| Multi-sensory impairment | 13 (76%) | 1 (6%) | 1 (6%) | 2 (12%) | 0 (0%) | 0 (0%) | 14 (88%) | 1 (6%) | 0 (0%) | 0 (0%) | 0 (0%) | 1 (2%) |
| Other difficulty or disability | 17 (71%) | 2 (8%) | 1 (4%) | 4 (17%) | 0 (0%) | 0 (0%) | 28 (80%) | 0 (0%) | 1 (3%) | 5 (14%) | 1 (3%) | 0 (0%) |
| Physical Disability | 71 (82%) | 3 (3%) | 1 (1%) | 10 (11%) | 0 (0%) | 2 (2%) | 107 (91%) | 2 (2%) | 1 (1%) | 7 (6%) | 1 (1%) | 0 (0%) |
| Profound & Multiple Learning Difficulty | 18 (86%) | 1 (5%) | 1 (5%) | 1 (5%) | 0 (0%) | 0 (0%) | 5 (83%) | 1 (17%) | 0 (0%) | 0 (0%) | 0 (0%) | 0 (0%) |
| SEN support but no specialist assessment of type of need | 0 (0%) | 0 (0%) | 0 (0%) | 0 (0%) | 0 (0%) | no data | 55 (80%) | 0 (0%) | 4 (6%) | 7 (10%) | 0 (0%) | 3 (0%) |
| Severe Learning Difficulty | 55 (82%) | 2 (3%) | 3 (4%) | 2 (3%) | 0 (0%) | 5 (7%) | 0 (0%) | 0 (0%) | 0 (0%) | 0 (0%) | no data | no data |
| Social, Emotional and Mental Health | 550 (84%) | 9 (1%) | 17 (3%) | 71 (11%) | 2 (0%) | 8 (1%) | 1,457 (84%) | 20 (1%) | 44 (3%) | 175 (10%) | 10 (1%) | 23 (1%) |
| Specific Learning Difficulty | 160 (88%) | 4 (2%) | 2 (1%) | 14 (8%) | 0 (0%) | 2 (1%) | 899 (89%) | 10 (1%) | 18 (2%) | 63 (6%) | 5 (0%) | 12 (1%) |
| Speech, Language and Communications needs | 494 (79%) | 42 (7%) | 37 (6%) | 37 (6%) | 9 (1%) | 6 (1%) | 893 (81%) | 55 (5%) | 52 (5%) | 85 (8%) | 7 (1%) | 11 (0%) |
| Visual Impairment | 20 (100%) | 0 (0%) | 0 (0%) | 0 (0%) | 0 (0%) | 0 (0%) | 46 (92%) | 0 (0%) | 1 (2%) | 1 (2%) | 1 (2%) | 1 (0%) |
For those local children and young people requiring SEN support, whilst the numbers for many are also relatively small the proportions that differ from the overall patterns in Figure 18 above include:
- A higher proportion of White pupils (88%) with Specific Learning Difficulty
- A higher proportion of Asian pupils (7%) with Speech, Language and Communication needs
- A higher proportion of Black pupils (6%) with Speech, Language and Communication needs
Suspensions, permanent exclusions and alternative provision settings
Table 16 summarises the latest data (2023/24) on suspensions and permanent exclusions from state-funded schools for children and young people in Central Bedfordshire and how this relates to data on eligibility for free school meals, gender, ethnicity and year group. The number of local suspensions for those on EHC Plans and receiving SEN support is comparable to regional and national levels. The numbers of permanent exclusions are small but similar to regional and national levels for SEN support. Though the proportions for those on EHC Plans are higher, the total number (n=16) of pupils is too small for meaningful tests of significance.
Table 16: A summary of suspensions and permanent exclusions data for SEND pupils in state-funded schools in Central Bedfordshire, 2023/24
| Suspensions & permanent exclusions (2023/24) | Suspensions CBC (number) | Supensions CBC (%) | Suspensions East of England (%) | Suspensions England (%) | Permanent exclusions CBC (number) | Permanent exclusions CBC (%) | Permanent exclusions East of England (%) | Permanent exclusions England (%) | |
| SEN provision | SEN support | 1,567 | 27.84 | 29.41 | 29.43 | 27 | 0.48 | 0.39 | 0.41 |
| EHC plan | 776 | 28.22 | 28.38 | 25.62 | 16 | 0.58 | 0.38 | 0.26 | |
| Sex | Female | 1,384 | 5.83 | 7.32 | 8.58 | 17 | 0.07 | 0.07 | 0.08 |
| Male | 3,054 | 12.27 | 13.52 | 13.93 | 60 | 0.24 | 0.16 | 0.18 | |
| FSM | Eligible | 2,130 | 32.00 | 28.39 | 27.55 | 46 | 0.69 | 0.33 | 0.33 |
| Not eligible | 2,308 | 5.50 | 5.97 | 5.99 | 31 | 0.07 | 0.06 | 0.06 | |
| Ethnicity | Asian / Asian British | 37 | 1.81 | 3.84 | 3.75 | 1 | 0.05 | 0.04 | 0.05 |
| Black / African / Caribbean / Black British | 156 | 9.69 | 7.02 | 7.84 | 4 | 0.25 | 0.10 | 0.10 | |
| Mixed / Multiple ethnic groups | 479 | 12.31 | 10.90 | 11.66 | 13 | 0.33 | 0.15 | 0.16 | |
| White | 3588 | 9.00 | 11.39 | 13.07 | 57 | 0.14 | 0.12 | 0.14 | |
| Any other ethnic group | 77 | 17.82 | 6.41 | 7.20 | 1 | 0.23 | 0.08 | 0.09 | |
| Ethnicity Unclassified | 101 | 13.27 | 16.16 | 16.10 | 1 | 0.13 | 0.15 | 0.17 | |
| Year group | Recpetion and Key Stage 1 (Year 2 and below) | 342 | 2.45 | 2.73 | 1.69 | 4 | 0.03 | 0.03 | 0.02 |
| Key Stage 2 (Years 3-6) | 661 | 4.40 | 3.75 | 2.86 | 11 | 0.07 | 0.04 | 0.04 | |
| Key Stage 3 (Years 7-9) | 2207 | 20.72 | 23.15 | 27.00 | 38 | 0.36 | 0.24 | 0.29 | |
| Key Stage 4 (Years 10-11) | 1174 | 18.57 | 20.53 | 23.72 | 24 | 0.38 | 0.25 | 0.27 | |
| College Years (Years 12 and above) | 31 | 1.15 | 0.95 | 1.00 | 0 | 0.00 | 0.01 | 0.01 | |
Some children and young people subject to permanent exclusion or other reasons for absence (e.g. long-term illness) can be moved into alternative provision settings (e.g. Pupil Referral Unit, AP Academy or Free School) to continue their education in Central Bedfordshire. Table 17 summarises the recent trend in local alternative provision (AP), where the number of AP pupils on EHC Plans has recently decreased and remains below the regional average but slightly above the national average. The number of local AP pupils on SEN support has also recently decreased but remains higher than the regional and national averages.
Table 17: Funded alternative provision in Central Bedfordshire by type of SEND support
| Funded alternative provision, by one year period | Headcount | EHC plans | EHC plans (%) | SEN support/SEN without an EHC plan | SEN support/SEN without an EHC plan (%) | |
| 2022/23 | Central Bedfordshire | 62 | 16 | 25.8 | 43 | 69.4 |
| East of England | 1,101 | 336 | 30.50 | 564 | 51 | |
| England | 13,191 | 3368 | 25.50 | 7518 | 57 | |
| 2023/24 | Central Bedfordshire | 74 | 22 | 29.70 | 52 | 70 |
| East of England | 1,345 | 421 | 31.30 | 568 | 42 | |
| England | 15,866 | 3837 | 24.20 | 9212 | 58 | |
| 2024/25 | Central Bedfordshire | 50 | 14 | 28.0 | 34 | 68.0 |
| East of England | 1363 | 426 | 31.3 | 586 | 43.0 | |
| England | 16,643 | 4380 | 26.3 | 9496 | 57.1 | |
Secondary Need
The final analysis here summarises the most recent data on secondary needs identified for SEND children and young people in state funded schools in Central Bedfordshire. As summarised in Table 18 below, for local pupils on EHC Plans the following secondary needs were most common. As a proportion, these were similar to regional and national percentages, except for:
- Speech, Language and Communication needs
- Social, Emotional and Mental Health needs (slightly higher than regional & national proportions)
- Autistic Spectrum Conditions
- Moderate Learning Difficulty
- Specific Learning Difficulty
Table 18 Proportion of secondary needs by EHC Plan/SEN support for Central Bedfordshire children and young people in 2024/25
| Secondary need | CBC EHC plan (number) | CBC EHC (%) | East of England EHC (%) | England EHC (%) | CBC SEN support (without EHC plan) (number) | CBC SEN (%) | East of England SEN (%) | England SEN (%) |
|---|---|---|---|---|---|---|---|---|
| Autistic Spectrum Disorder | 227 | 7.4 | 10.0 | 7.1 | 144 | 2.5 | 2.1 | 1.9 |
| Hearing impairment | 22 | 0.7 | 0.6 | 0.6 | 12 | 0.2 | 0.2 | 0.2 |
| Moderate Learning Difficulty | 148 | 4.8 | 4.2 | 4.7 | 116 | 2.0 | 2.0 | 2.5 |
| Multi-sensory Impairment | 17 | 0.6 | 0.4 | 0.5 | 10 | 0.2 | 0.1 | 0.2 |
| Other Difficulty or Disability | 45 | 1.5 | 2.1 | 2.2 | 68 | 1.2 | 1.1 | 1.1 |
| Physical Disability | 37 | 1.2 | 1.6 | 1.7 | 22 | 0.4 | 0.5 | 0.5 |
| Profound and Multiple Learning Difficulty | 8 | 0.3 | 0.3 | 0.3 | 1 | 0.0 | 0.0 | 0.0 |
| SEN support but no specialist assessment of type of need | 0 | 0 | 0 | 0.0 | 46 | 0.8 | 0.7 | 0.5 |
| Severe Learning Difficulty | 58 | 1.9 | 1.4 | 2.0 | 0 | 0.0 | 0.0 | 0.1 |
| Social, Emotional and Mental Health | 312 | 10.2 | 7.4 | 7.4 | 349 | 6.2 | 5.0 | 4.9 |
| Specific Learning Difficulty | 100 | 3.3 | 3.3 | 2.7 | 121 | 2.1 | 2.3 | 2.1 |
| Speech, Language and Communications needs | 316 | 10.3 | 10.3 | 12.3 | 164 | 2.9 | 3.2 | 3.7 |
| Visual impairment | 20 | 0.7 | 0.7 | 0.7 | 10 | 0.2 | 0.2 | 0.2 |
| Grand Total | 1310 | 1063 |
For local pupils with SEN support the following secondary needs were most common and, as a proportion, were similar to regional and national percentages:
- Social, Emotional and Mental Health needs
- Speech, Language and Communication needs
- Autistic Spectrum Conditions
- Specific Learning Difficulty
- Moderate Learning Difficulty
Lastly, Table 19 below summarises the most recent data on the top three secondary needs for the five most common primary needs for local pupils in state-funded schools. For those on EHC Plans, the proportions of the top three secondary needs by primary need are generally similar to regional and national averages. Notable differences included:
- Higher proportions of pupils with Autistic Spectrum Conditions (primary) and Social, Emotional and Mental Health needs (secondary)
- Lower proportions of pupils with Moderate Learning Difficulty (primary) and Speech, Language and Communication needs (secondary) but the numbers of pupils for the latter are small (n=28).
Similarly, for those local pupils receiving SEN support the proportions of top three secondary needs by primary need are similar to regional and national averages. Notable differences were:
- Higher proportions of pupils with Autistic Spectrum Conditions (primary) and Social, Emotional and Mental Health needs (secondary)
Table 19: Top three secondary needs by primary need for EHC Plan/SEN support for Central Bedfordshire children and young people in 2024/25
| Primary need type | Top 3 secondary need | CBC EHC plan (number) | CBC EHC (%) | East of England EHC (%) | England EHC (%) | CBC SEN support (without EHC plan) (no) | CBC SEN (%) | East of England SEN (%) | England SEN (%) |
|---|---|---|---|---|---|---|---|---|---|
| Autistic Spectrum Condition | Speech, Language and Communications needs | 192 | 17.9 | 16.2 | 17.8 | 41 | 6.7 | 7.6 | 9.2 |
| Social, Emotional and Mental Health | 179 | 16.7 | 11.6 | 10.3 | 116 | 18.9 | 14.4 | 13.7 | |
| Specific Learning Difficulty | 46 | 4.3 | 3.2 | 2.5 | 21 | 3.4 | 2.9 | 3.1 | |
| Social, Emotional and Mental Health | Autistic Spectrum Disorder | 96 | 14.6 | 12.8 | 11.0 | 84 | 4.9 | 4.1 | 3.3 |
| Speech, Language and Communications needs | 39 | 5.9 | 7.5 | 10.5 | 62 | 3.6 | 3.7 | 4.6 | |
| Moderate Learning Difficulty | 23 | 3.5 | 4.5 | 4.2 | 61 | 3.5 | 3.5 | 3.1 | |
| Speech, Language and Communications needs | Autistic Spectrum Disorder | 96 | 14.6 | 12.8 | 11.0 | 84 | 4.9 | 4.1 | 3.3 |
| Speech, Language and Communications needs | 39 | 5.9 | 7.5 | 10.5 | 62 | 3.6 | 3.7 | 4.6 | |
| Moderate Learning Difficulty | 23 | 3.5 | 4.5 | 4.2 | 61 | 3.5 | 3.5 | 3.1 | |
| Moderate Learning Difficulty | Speech, Language and Communications needs | 28 | 11.7 | 17.4 | 21.6 | 37 | 4.4 | 4.9 | 5.5 |
| Social, Emotional and Mental Health | 24 | 10.0 | 9.6 | 10.2 | 41 | 4.9 | 5.6 | 5.7 | |
| Autistic Spectrum Disorder | 19 | 7.9 | 13.7 | 7.8 | 14 | 1.7 | 1.1 | 0.8 | |
| Specific Learning Difficulty | Social, Emotional and Mental Health | 19 | 10.4 | 11.9 | 11.4 | 71 | 7.1 | 5.7 | 5.6 |
| Autistic Spectrum Disorder | 19 | 10.4 | 7.3 | 7.4 | 16 | 1.6 | 1.1 | 1.2 | |
| Speech, Language and Communications needs | 16 | 8.8 | 10.9 | 13.4 | 16 | 1.6 | 2.7 | 3.1 |
Projections of future demand for SEN provision
The proportion of school pupils receiving SEN provisions in Central Bedfordshire has increased but has been consistently below that of comparator local authorities and England as a whole. Therefore, in addition to the number of children receiving SEN changing in line with the population growth, it is also likely that it will increase further because of a higher proportion of children being identified with SEN. To understand the future demand for SEN provision, five different projection scenarios have been created for the next five years. As summarised below, Scenario 1 is based on a linear projection assuming that recent changes continue to 2029/30. Four alternative scenarios alongside four alternative projections sees proportions of school pupils with SEN provision applied to locally-developed population forecasts. For more background to these longer-term forecasting methods and the assumptions underpinning them please visit the Population Forecast Dashboard[1].
Figure 19: Five projections for future demand for SEN provision in Central Bedfordshire
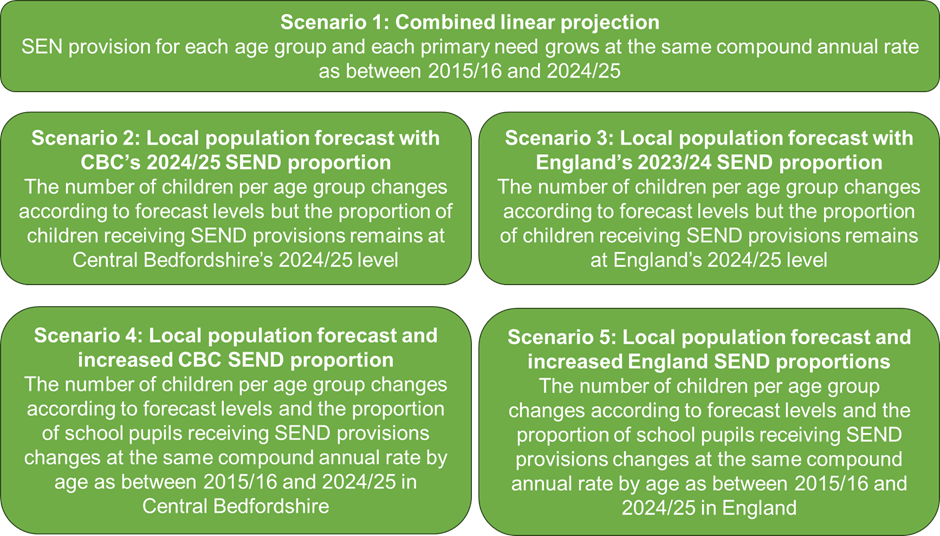
The five scenarios suggest that increases will be driven primarily by an increase in the proportion of children and young people receiving SEN provision rather than by an increase in the overall local population size. Further, the data behind these projections suggests that the rate of increase in the proportion of local school children with EHC Plans is growing much faster than for England overall. As summarised in Table 20 below, from a baseline of 8,807 pupils in 2024/25 there is potential for the number receiving SEN provision to increase from 324 to 3,133 pupils by 2029/30. Notably, Scenario 4 forecasts an increase in the numbers of CYP on EHC Plans that is not far off the numbers needing SEN support in the next five years. Time and monitoring will inform which scenario best summarises what is actually happening to the local SEN population but it is hoped these projections will help to inform discussions about this.
Table 20 Projections for future demand in 2029/30 by scenario and type of SEN provision
| Scenario | Number of pupils in 2029/30 | ||
| EHC Plan | SEN Support | All SEND | |
| From 2024/25 baseline | 3,128 | 5,679 | 8,807 |
| Scenario 1 | 3,893 | 6,312 | 10,205 |
| Scenario 2 | 3,216 | 5,914 | 9,131 |
| Scenario 3 | 2,561 | 6,853 | 9,414 |
| Scenario 4 | 5,742 | 6,047 | 11,789 |
| Scenario 5 | 3,921 | 8,019 | 11,940 |
References
[1] Children & Young People | Central Bedfordshire JSNA
[2] See Special Educational Needs in England Free School Meals data (Accessed 17/10/2025)
[3] See: Population Forecasts 2023–2043 | Central Bedfordshire JSNA