

SEND primary need prevalence
SEND primary need prevalence
Please note: the full report can be downloaded via the link at the bottom of the SEND Executive Summary section.
Table 6 summarises the recent trends in primary needs identified in children and young people across Central Bedfordshire. Notable trends in the last nine years include more than 2500 more children and young people receiving SEN and whilst some primary needs have remained relatively stable, others have greatly increased in number. Notably the local populations identified with Autistic Spectrum Conditions, Social, Emotional and Mental Health needs and Speech, Language and Communication needs have each more than doubled in size over the last nine years and continue to increase. Populations with Specific and Moderate Learning Difficulties also remain high.
Table 6: Trend in number of children and young people in all state-funded schools[1] receiving SEN provision in Central Bedfordshire by primary need
| Primary need | 2015/16 | 2016/17 | 2017/18 | 2018/19 | 2019/20 | 2020/21 | 2021/22 | 2022/23 | 2023/24 | 2024/25 |
|---|---|---|---|---|---|---|---|---|---|---|
| Autistic Spectrum Condition | 659 | 719 | 794 | 874 | 1003 | 1039 | 1168 | 1356 | 1574 | 1686 |
| Hearing Impairment | 93 | 94 | 93 | 106 | 115 | 122 | 118 | 116 | 117 | 117 |
| Moderate Learning Difficulty | 1254 | 1237 | 1033 | 996 | 1190 | 1176 | 1214 | 1220 | 1161 | 1079 |
| Multi- Sensory Impairment | 17 | 17 | 25 | 30 | 30 | 32 | 37 | 38 | 34 | 33 |
| Other Difficulty/Disability | 248 | 255 | 259 | 257 | 24 | 28 | 49 | 71 | 93 | 59 |
| Physical Disability | 144 | 152 | 178 | 162 | 227 | 205 | 220 | 220 | 213 | 205 |
| Profound & Multiple Learning Difficulty | 46 | 45 | 46 | 40 | 37 | 35 | 33 | 33 | 29 | 27 |
| SEN support but no specialist assessment of type of need | 581 | 619 | 652 | 671 | 129 | 31 | 35 | 73 | 47 | 69 |
| Severe Learning Difficulty | 208 | 230 | 226 | 219 | 197 | 190 | 182 | 161 | 136 | 67 |
| Social, Emotional and Mental Health | 1040 | 1095 | 1145 | 1258 | 1499 | 1614 | 1821 | 2054 | 2174 | 2386 |
| Specific Learning Difficulty | 931 | 866 | 852 | 891 | 1051 | 1139 | 1068 | 1139 | 1184 | 1189 |
| Speech, Language and Communications needs | 664 | 765 | 861 | 930 | 1117 | 1262 | 1404 | 1526 | 1631 | 1728 |
| Visual Impairment | 44 | 41 | 49 | 50 | 56 | 57 | 59 | 65 | 70 | 70 |
| Grand Total | 5929 | 6135 | 6213 | 6484 | 6675 | 6930 | 7408 | 8072 | 8463 | 8715 |
Table 7 splits the most recent primary need data by the type of SEN provided across the local state-funded school population. For those pupils with an EHC plan, the greatest primary needs were Autistic Spectrum Conditions (35%) followed by Social, Emotional and Mental Health (21%) and Speech, Language and Communication (20%) needs. These local proportions are similar to or slightly higher than the regional and national averages for pupils with an EHC Plan, as summarised in Table 6.
Table 7: Primary need for all state-funded schools by SEN provision in Central Bedfordshire, East of England and England in 2024/25
| Primary need | CBC EHC plan (number) | CBC EHC (%) | East of England EHC (%) | England EHC (%) | CBC SEN support (without EHC plan) (number) | CBC SEN (%) | East of England SEN (%) | England SEN (%) |
|---|---|---|---|---|---|---|---|---|
| Autistic Spectrum Disorder | 1073 | 35.0 | 31.2 | 33.6 | 613 | 10.8 | 10.4 | 9.7 |
| Downs Syndrome | 16 | 0.5 | 0.4 | 0.3 | 2 | 0.0 | 0.0 | 0.0 |
| Hearing Impairment | 40 | 1.3 | 1.9 | 1.4 | 77 | 1.4 | 1.4 | 1.5 |
| Moderate Learning Difficulty | 239 | 7.8 | 9.6 | 7.8 | 840 | 14.8 | 12.1 | 14.4 |
| Multi-sensory impairment | 17 | 0.6 | 0.4 | 0.3 | 16 | 0.3 | 0.2 | 0.3 |
| Other difficulty or disability | 24 | 0.8 | 1.9 | 2.0 | 35 | 0.6 | 3.6 | 3.5 |
| Physical Disability | 87 | 2.8 | 3.4 | 3.3 | 118 | 2.1 | 1.9 | 1.8 |
| Profound & Multiple Learning Difficulty | 21 | 0.7 | 1.7 | 2.2 | 6 | 0.1 | 0.1 | 0.1 |
| SEN support but no specialist assessment of type of need | n/a | n/a | n/a | n/a | 69 | 1.2 | 6.1 | 4.9 |
| Severe Learning Difficulty | 67 | 2.2 | 9.0 | 7.0 | no data | no data | 0.1 | 0.2 |
| Social, Emotional and Mental Health | 657 | 21.4 | 17.0 | 16.0 | 1729 | 30.5 | 26.1 | 23.6 |
| Specific Learning Difficulty | 182 | 5.9 | 5.3 | 4.3 | 1007 | 17.8 | 16.2 | 13.6 |
| Speech, Language and Communications needs | 625 | 20.4 | 17.3 | 20.7 | 1103 | 19.5 | 21.0 | 25.7 |
| Visual Impairment | 20 | 0.7 | 0.9 | 0.9 | 50 | 0.9 | 0.7 | 0.8 |
| Grand Total | 3068 | 5665 |
In Table 7, for those pupils receiving SEN support the greatest primary needs were Social, Emotional and Mental Health (31%), Speech, Language and Communication (19%) and Specific (18%) and Moderate (15%) Learning Difficulties. These local proportions sometimes differed from regional and national averages. Whilst the percentage of local pupils receiving SEN support for Autistic Spectrum Condition is similar, the percentages with Specific Learning Difficulties and Social, Emotional and Mental Health support needs are higher than regional and national averages. Further, the local percentage of pupils with Speech, Language and Communications needs (19%) is lower than the regional (21%) and national (26%) averages.
Uncertain impacts of COVID-19 pandemic
Across the age ranges reported below it’s not possible to measure the impacts of COVID-19 restrictions on the prevalence of primary needs of the local SEND population. The data reported below have not been adjusted for the COVID-19 pandemic, particularly for the peak periods of 2019/20 and 2020/21, and therefore reflect the restrictions and changes to services during these periods and should be treated with caution. For example, sometimes the numbers of pupils are too small to establish whether there is a significant difference associated with the pandemic. Reductions in prevalence during the pandemic periods might reflect reduced access to services, including those to diagnose primary needs. Changes for primary needs relating to Social, Emotional and Mental Health, Speech Language and Communications, Autistic Spectrum Condition and Learning Difficulties are sometimes noticeable but must also be interpreted with caution because it can be hard to separate COVID-19 from other factors influencing primary needs. Lastly, from 2021/22 any increases in prevalence might reflect services catching up with backlogs and re-aligning with pre-pandemic trends. However, caution is also needed here because other factors could have an influence, particularly where changes to services and support have taken place. The following sections now break down primary need by age.
Early Years
In 2024/25, 192 local children aged 4 years and under were identified with SEN, of which 20 had EHC plans and 172 received SEN Support and their primary needs are summarised in Table 8. Here the numbers on EHC Plans are very small but the proportions by primary need are generally similar to those reported across the East of England region and England. For SEN support, the numbers of children are greater but still small and generally similar across many primary needs when compared to regional and national averages. Notable differences to regional/national averages include no reported local children with Severe or Profound Learning Difficulties and a higher local proportion with Speech, Language and Communications needs.
Table 8: Primary need for state-funded Early Years by SEN provision in Central Bedfordshire, East of England and England in 2024/25
| Primary need | CBC EHC plan (number) | CBC EHC (%) | East of England EHC (%) | England EHC (%) | CBC SEN support (without EHC plan) (number) | CBC SEN (%) | East of England SEN (%) | England SEN (%) |
|---|---|---|---|---|---|---|---|---|
| Autistic Spectrum Disorder | 4 | 0.4 | 0.3 | 0.3 | 12 | 2 | 1.5 | 1.9 |
| Downs Syndrome | 1 | 6.3 | 1 | 4 | 2 | 100 | 45.8 | 48.4 |
| Hearing Impairment | 2 | 5 | 1.4 | 1 | 2 | 2.6 | 1.7 | 2.2 |
| Moderate Learning Difficulty | 0 | 0 | 0 | 0.2 | 9 | 1.1 | 0.5 | 0.3 |
| Multi-sensory impairment | 0 | 0 | 1.1 | 1.4 | 1 | 6.3 | 1 | 2 |
| Other difficulty or disability | 0 | 0 | 0.8 | 0.7 | 0 | 0 | 1.1 | 1.3 |
| Physical Disability | 0 | 0 | 0.9 | 1.1 | 4 | 3.4 | 2.6 | 3.2 |
| Profound & Multiple Learning Difficulty | 1 | 4.8 | 1.8 | 1.8 | 0 | 0 | 6.2 | 23.2 |
| SEN support but no specialist assessment of type of need | n/a | n/a | n/a | n/a | 2 | 2.9 | 1.8 | 1.7 |
| Severe Learning Difficulty | 0 | 0 | 0.2 | 0.4 | no data | no data | 16.2 | 12.2 |
| Social, Emotional and Mental Health | 2 | 0.3 | 0.1 | 0.1 | 29 | 1.7 | 0.6 | 0.7 |
| Specific Learning Difficulty | 1 | 0.5 | 0.9 | 0.5 | 3 | 0.3 | 0.3 | 0.3 |
| Speech, Language and Communications needs | 9 | 1.4 | 0.8 | 1 | 108 | 9.8 | 5 | 6.4 |
| Visual Impairment | 0 | 0 | 0.9 | 1 | 0 | 0 | 1.5 | 1.7 |
| Total | 20 | 172 |
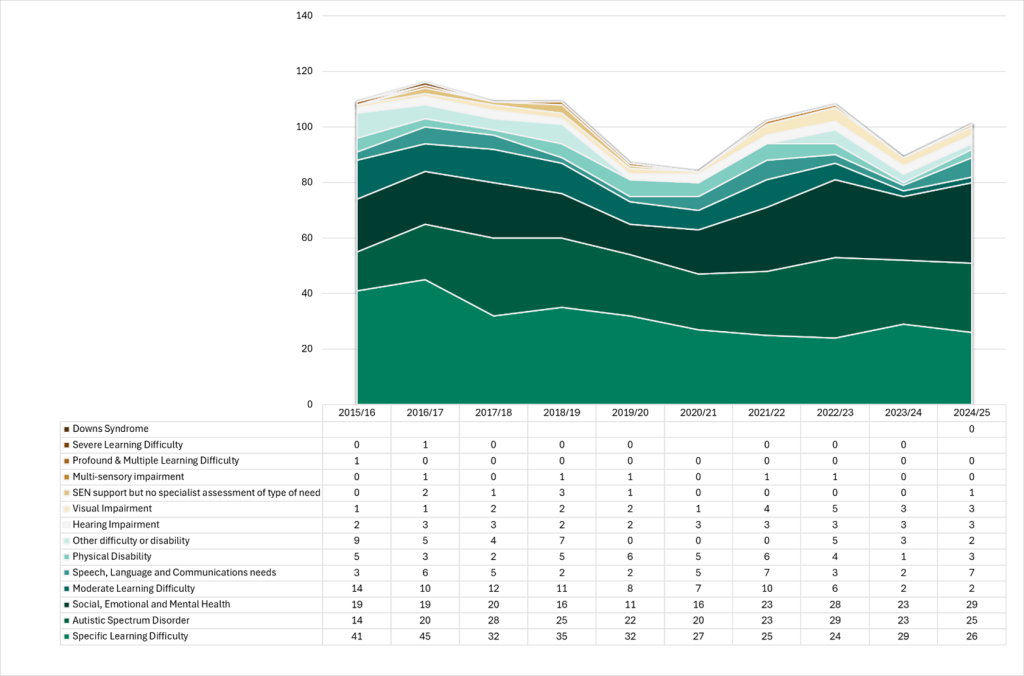
Further data analysis for Early years children on EHC support is not possible because the numbers remained at or below 25 in recent years but Figure 2 below summarises the recent trend in primary need for those on SEN support. Here small numbers also make it hard to identify trends with any confidence, but the number of Early Years children with Speech, Language and Communication primary support needs has more than doubled in the last nine years and continues to increase.
Figure 2: Number of Early Years children receiving SEN provision by primary need in Early Years
Reception
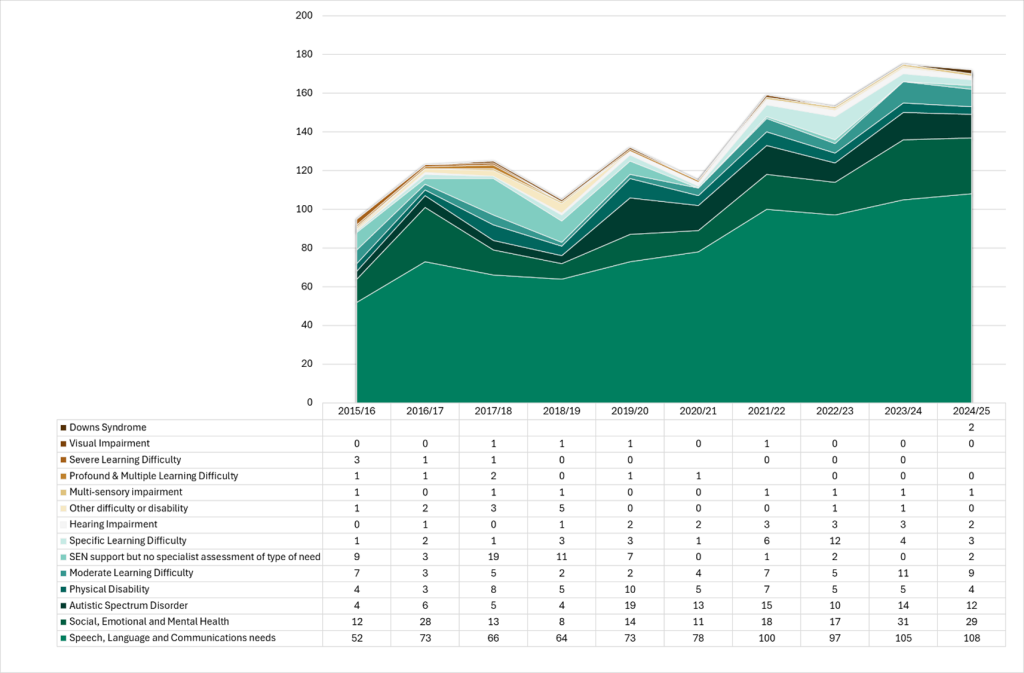
In 2024/25, the total number of children with SEND in reception in Central Bedfordshire was 425, with 136 children on an EHC plan and 289 children receiving SEN Support. As summarised in Table 9 below, for those on EHC Plans the numbers of children for some primary needs are small. For those with greater numbers, the proportions for Autistic Spectrum Conditions and Speech, Language and Communication needs are similar to those across the East of England and England. For SEN support, the numbers of children are also small and similar across many primary needs when compared to regional and national averages. One notable difference is a slightly higher proportion of local children with Social, Emotional and Mental Health needs compared to regional and national averages.
Table 9: Primary need for state-funded Reception by SEN provision in Central Bedfordshire, East of England and England in 2024/25
| Primary need | CBC EHC plan (number) | CBC EHC (%) | Est of England EHC (%) | England EHC (%) | CBC SEN support (without EHC plan) (number) | CBC SEN (%) | East of England SEN (%) | England SEN (%) |
|---|---|---|---|---|---|---|---|---|
| Autistic Spectrum Disorder | 51 | 4.8 | 6.2 | 5.8 | 25 | 4.1 | 6.5 | 5.0 |
| Downs Syndrome | 3 | 18.8 | 18.0 | 19.1 | 0 | 0.0 | 33.3 | 29.3 |
| Hearing Impairment | 0 | 0.0 | 3.6 | 4.6 | 4 | 5.2 | 4.4 | 4.8 |
| Moderate Learning Difficulty | 5 | 2.1 | 1.5 | 1.4 | 12 | 1.4 | 1.4 | 1.2 |
| Multi-sensory impairment | 1 | 5.9 | 2.2 | 3.7 | 2 | 12.5 | 3.1 | 4.6 |
| Other difficulty or disability | 0 | 0.0 | 3.6 | 3.8 | 1 | 2.9 | 3.2 | 2.9 |
| Physical Disability | 4 | 4.6 | 4.7 | 4.3 | 6 | 5.1 | 4.7 | 5.2 |
| Profound & Multiple Learning Difficulty | 1 | 4.8 | 4.6 | 5.5 | 0 | 0.0 | 20.0 | 12.1 |
| SEN support but no specialist assessment of type of need | n/a | n/a | n/a | n/a | 0 | 0.0 | 5.7 | 4.8 |
| Severe Learning Difficulty | 2 | 3.0 | 3.1 | 3.7 | no data | no data | 13.4 | 9.1 |
| Social, Emotional and Mental Health | 9 | 1.4 | 0.9 | 1.0 | 85 | 4.9 | 3.2 | 2.9 |
| Specific Learning Difficulty | 2 | 1.1 | 3.4 | 3.4 | 6 | 0.6 | 0.7 | 0.7 |
| Speech, Language and Communications needs | 56 | 9.0 | 8.5 | 9.0 | 144 | 13.1 | 12.7 | 12.5 |
| Visual Impairment | 2 | 10.0 | 4.0 | 3.7 | 4 | 8.0 | 4.3 | 3.5 |
| Total | 136 | 289 |
Further data analysis for Reception children on EHC Plan is summarised in Figure 3 below. Whilst the numbers are small, the increasing numbers of children with Autistic Spectrum Disorders are clear. It is also notable that the numbers of children with Speech, Language and Communication needs remains high but has fallen in the last year. With similar analysis for SEN support children in Figure 4 below, most notable are increases in the numbers of children with Social, Emotional and Support Needs and the continued predominance of children with Speech, Language and Communication needs.
Figure 3: The number of children on EHC Plan by primary need in Reception, 2015/16-2024/25
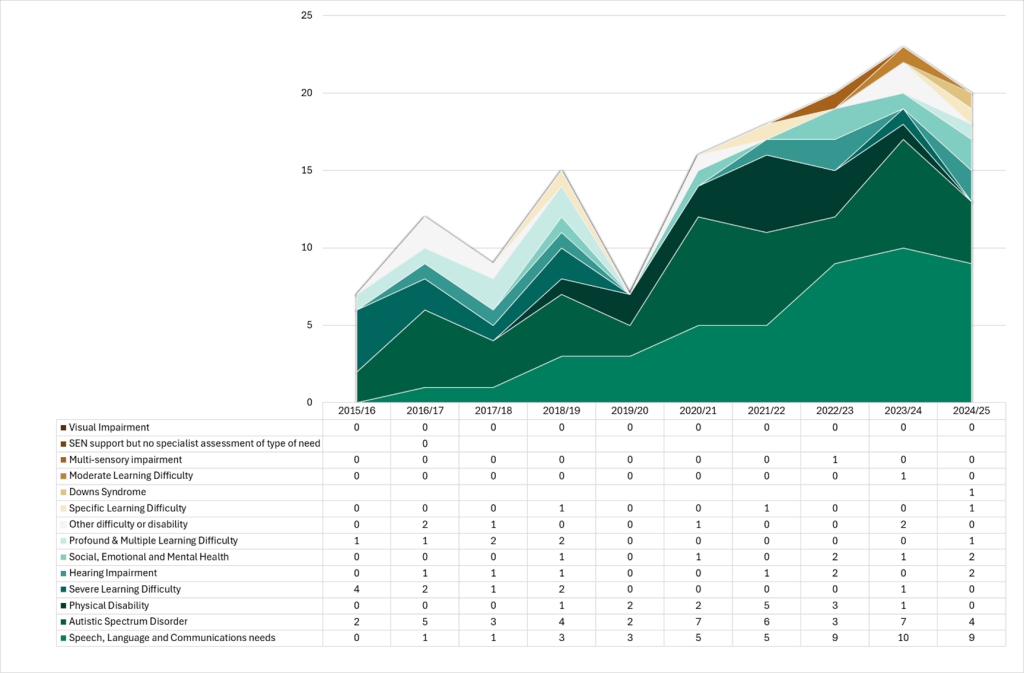
Figure 4: The number of children with SEN support by primary need in Reception, 2015/16-2024/25
Key Stage 1 (Years 1-2)
In 2024/25 the number of local SEND children in Key Stage 1 was 1,318, with 442 with an EHC plan and 876 children receiving SEN Support. As summarised in Table 10 below, for those on EHC Plans the numbers of children by some primary needs are small. For those with greater numbers, the proportions for Autistic Spectrum Conditions are lower than regional and national averages but for Speech, Language and Communications needs the local proportion is higher with the same comparison. For SEN support, the numbers of children are also small and similar across many primary needs when compared to regional and national averages. However, notable differences to regional and national averages are higher proportions of local children with Moderate Learning Difficulties and Social, Emotional and Mental Health needs.
Table 10: Primary need for state-funded Key Stage 1 by SEN provision in Central Bedfordshire, East of England and England in 2024/25
| Primary need | CBC EHC plan (number) | CBC EHC (%) | East of England EHC (%) | England EHC (%) | CBC SEN support (without EHC plan) (number) | CBC SEN (%) | East of England SEN (%) | England SEN (%) |
|---|---|---|---|---|---|---|---|---|
| Autistic Spectrum Disorder | 137 | 12.8 | 17.0 | 15.5 | 75 | 12.2 | 11.3 | 10.8 |
| Downs Syndrome | 6 | 37.5 | 24.0 | 21.1 | 0 | 0.0 | 8.3 | 12.9 |
| Hearing Impairment | 6 | 15.0 | 12.0 | 11.4 | 12 | 15.6 | 15.6 | 15.0 |
| Moderate Learning Difficulty | 15 | 6.3 | 4.9 | 4.7 | 133 | 15.8 | 10.7 | 9.4 |
| Multi-sensory impairment | 2 | 11.8 | 14.4 | 13.4 | 2 | 12.5 | 12.1 | 14.5 |
| Other difficulty or disability | 2 | 8.3 | 12.1 | 10.5 | 4 | 11.4 | 11.1 | 9.5 |
| Physical Disability | 16 | 18.4 | 13.4 | 12.5 | 16 | 13.6 | 14.3 | 13.4 |
| Profound & Multiple Learning Difficulty | 2 | 9.5 | 15.2 | 13.9 | 3 | 50.0 | 26.2 | 14.2 |
| SEN support but no specialist assessment of type of need | n/a | n/a | n/a | n/a | 3 | 4.3 | 18.5 | 17.1 |
| Severe Learning Difficulty | 3 | 4.5 | 11.6 | 11.4 | no data | no data | 14.5 | 12.1 |
| Social, Emotional and Mental Health | 49 | 7.5 | 6.2 | 6.5 | 253 | 14.6 | 12.5 | 12.0 |
| Specific Learning Difficulty | 15 | 8.2 | 7.8 | 7.7 | 56 | 5.6 | 4.3 | 4.2 |
| Speech, Language and Communications needs | 186 | 29.8 | 21.1 | 21.6 | 315 | 28.6 | 28.3 | 26.6 |
| Visual Impairment | 3 | 15.0 | 9.7 | 9.0 | 4 | 8.0 | 11.6 | 11.4 |
| Grand Total | 442 | 876 |
Further analysis for KS1 children on EHC Plans is summarised in Figure 5 below. Whilst the numbers are small for many needs, the increasing numbers of children with Social, Emotional and Mental Health and Speech, Language and Communication needs are clear, whilst needs relating to Autistic Spectrum Disorders remain high. Similar analysis for SEN Support children is summarised in Figure 6 below. The numbers are small for some needs and remain steady for others. Whilst the number of local children with Speech, Language and Communication has nearly doubled in the last nine years and remains high it decreased in the last year. Notably, the numbers of children with Social, Emotional and Mental Health needs continue to increase but at a lower rate than in previous years.
Figure 5: The number of children on EHC Plan by primary need in Key Stage 1, 2015/16-2024/25
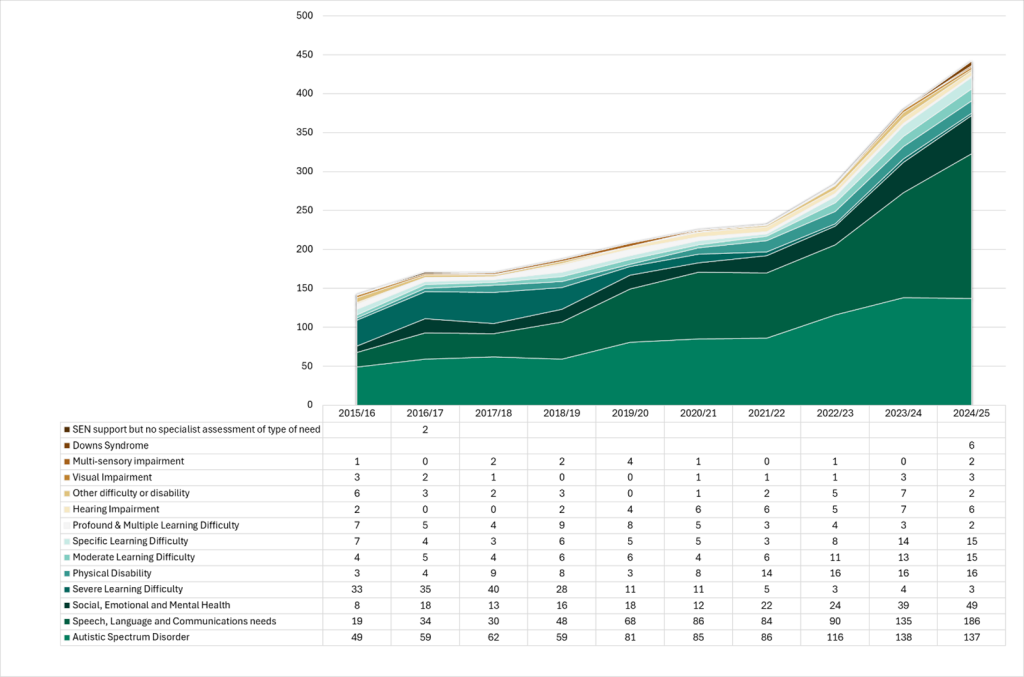
Figure 6: Trend in the number of local children on SEN support by primary need in KS1, 2015/16-2024/25
Key Stage 2 (Years 3-6)
In 2024/25, the number of local KS2 children identified with SEND was 3,036, with 986 on an EHC plan in place and 2,050 receiving SEN Support. In Table 11 below, for those on EHC Plans the numbers of children by some primary needs is small. For more prevalent needs including Autistic Spectrum Conditions, Social, Emotional and Mental Health needs and Speech, Language and Communication needs, the proportions are similar to those across the East of England and England. For SEN support, the proportions of children for most needs were generally similar to regional and national averages. One notable difference were higher proportions of local children with Moderate Learning Difficulties (51%) when compared to the national average (45%), though regional levels were similar (48%).
Table 11: Primary need for state-funded Key Stage 2 by SEN provision in Central Bedfordshire, East of England and England in 2024/25
| Primary need | CBC EHC plan (number) | CBC EHC (%) | East of England EHC (%) | England EHC (%) | CBC SEN support (without EHC plan) (number) | CBC SEN (%) | East of England SEN (%) | England SEN (%) |
|---|---|---|---|---|---|---|---|---|
| Autistic Spectrum Disorder | 358 | 33.4 | 32.0 | 31.5 | 184 | 30.0 | 29.3 | 28.8 |
| Downs Syndrome | 2 | 12.5 | 32.0 | 31.6 | 0 | 0.0 | 8.3 | 8.4 |
| Hearing Impairment | 18 | 45.0 | 31.6 | 30.3 | 26 | 33.8 | 30.5 | 30.7 |
| Moderate Learning Difficulty | 63 | 26.4 | 26.6 | 26.9 | 432 | 51.4 | 48.3 | 45.3 |
| Multi-sensory impairment | 4 | 23.5 | 34.8 | 33.6 | 8 | 50.0 | 42.9 | 36.6 |
| Other difficulty or disability | 3 | 12.5 | 31.0 | 29.2 | 9 | 25.7 | 31.6 | 31.4 |
| Physical Disability | 29 | 33.3 | 30.3 | 31.1 | 32 | 27.1 | 31.6 | 31.7 |
| Profound & Multiple Learning Difficulty | 5 | 23.8 | 28.5 | 29.6 | 1 | 16.7 | 26.2 | 22.2 |
| SEN support but no specialist assessment of type of need | n/a | n/a | n/a | n/a | 31 | 44.9 | 49.1 | 46.7 |
| Severe Learning Difficulty | 13 | 19.4 | 32.5 | 28.5 | no data | no data | 31.8 | 33.3 |
| Social, Emotional and Mental Health | 203 | 30.9 | 31.8 | 31.4 | 573 | 33.1 | 35.9 | 35.7 |
| Specific Learning Difficulty | 53 | 29.1 | 27.4 | 27.5 | 341 | 33.9 | 34.2 | 33.3 |
| Speech, Language and Communications needs | 230 | 36.8 | 36.1 | 36.5 | 402 | 36.4 | 36.4 | 36.4 |
| Visual Impairment | 5 | 25.0 | 34.6 | 29.7 | 11 | 22.0 | 30.7 | 30.8 |
| Grand Total | 986 | 2050 |
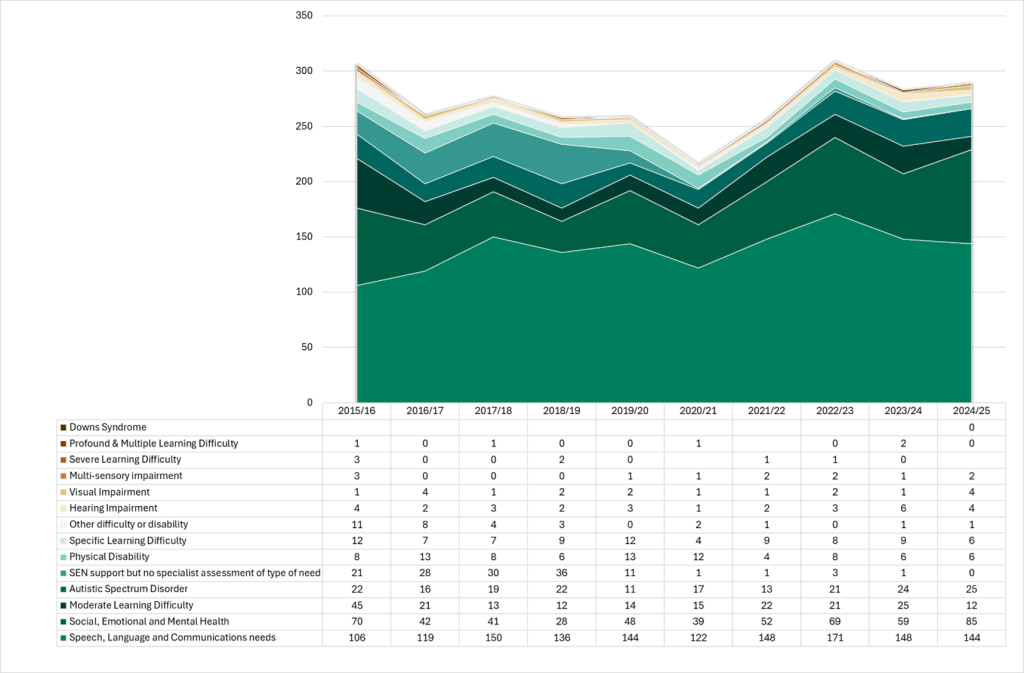
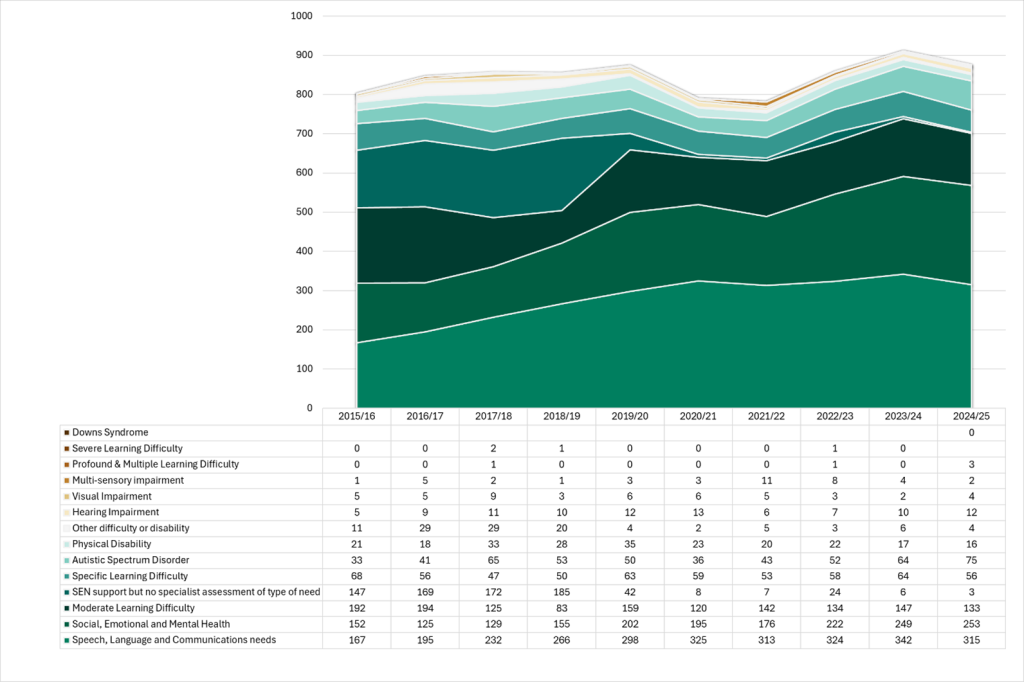
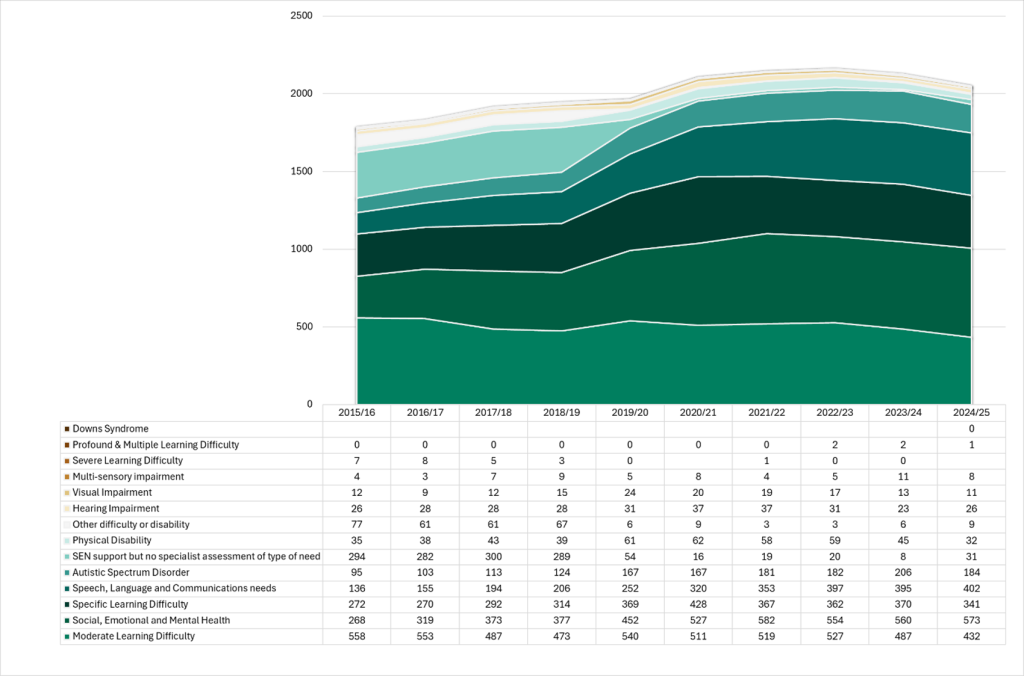
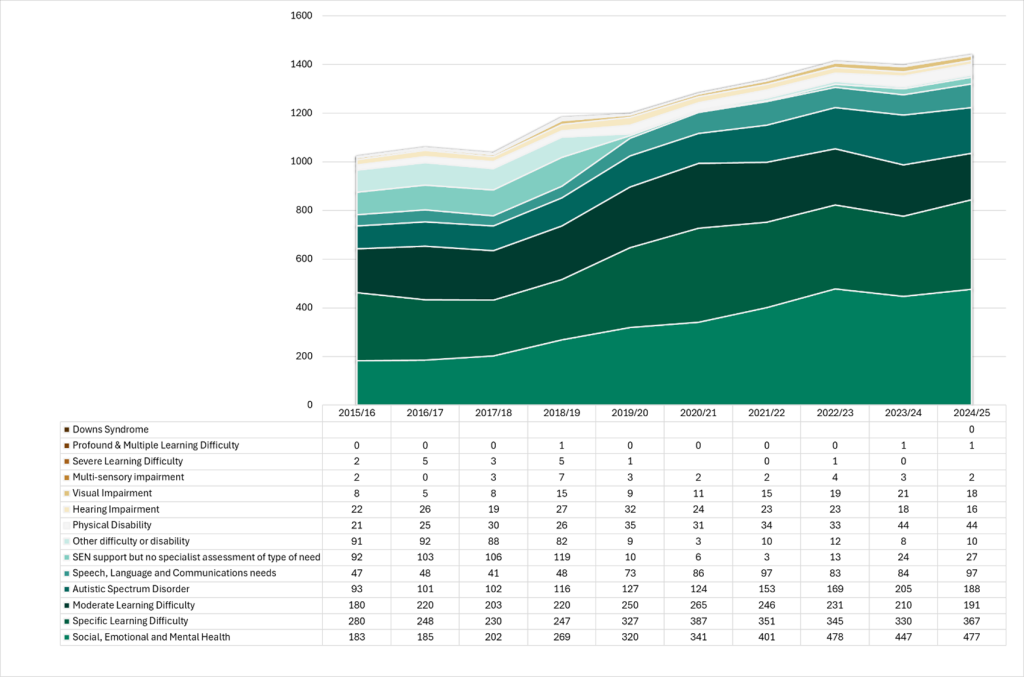
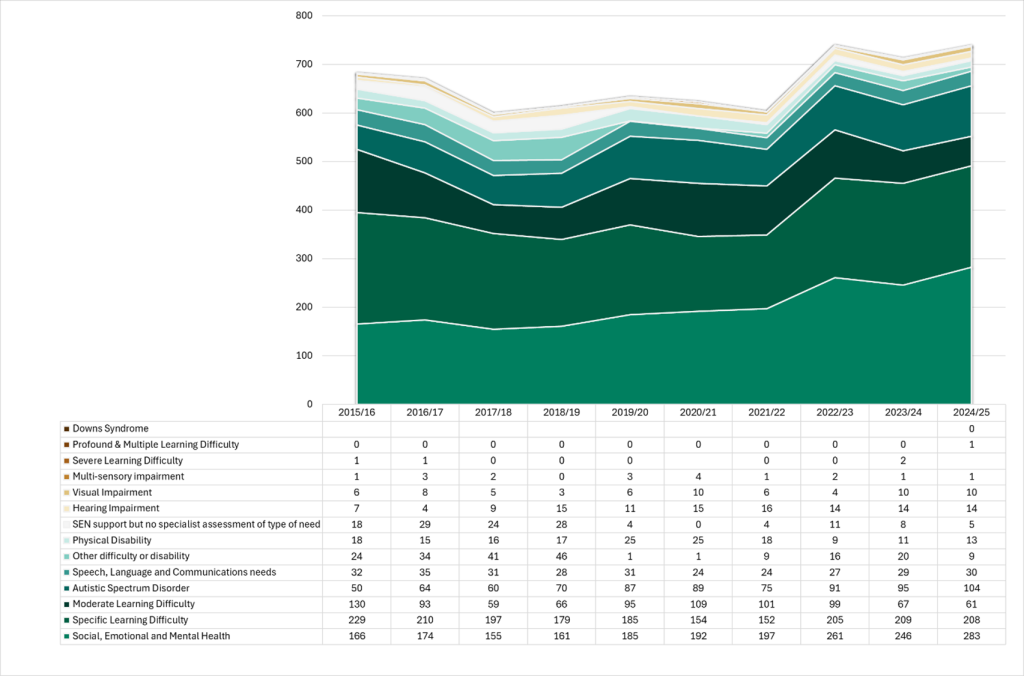
Further analysis for KS2 children on EHC Plans is summarised in Figure 7 below. Whilst the numbers are small for many primary needs, as at Key Stage 1, the increasing numbers of children with Social, Emotional and Mental Health needs, Speech, Language and Communication needs and Autistic Spectrum Conditions are clear. Further, whilst the overall numbers of children on EHC Plans with Moderate Learning Difficulties continues to increase, the recent decrease in the numbers of children with Severe Learning Difficulties continues. Similar analysis for KS2 children on SEN Support is summarised in Figure 8 below. The numbers are small for some needs but others are much higher, though falling in the most recent year (e.g. Autistic Spectrum Conditions). Numbers of children with Social, Emotional and Mental Health and Speech, Language and Communication needs remain high.
Figure 7: The number of children on EHC Plan by primary need in Key Stage 2, 2015/16-2024/25
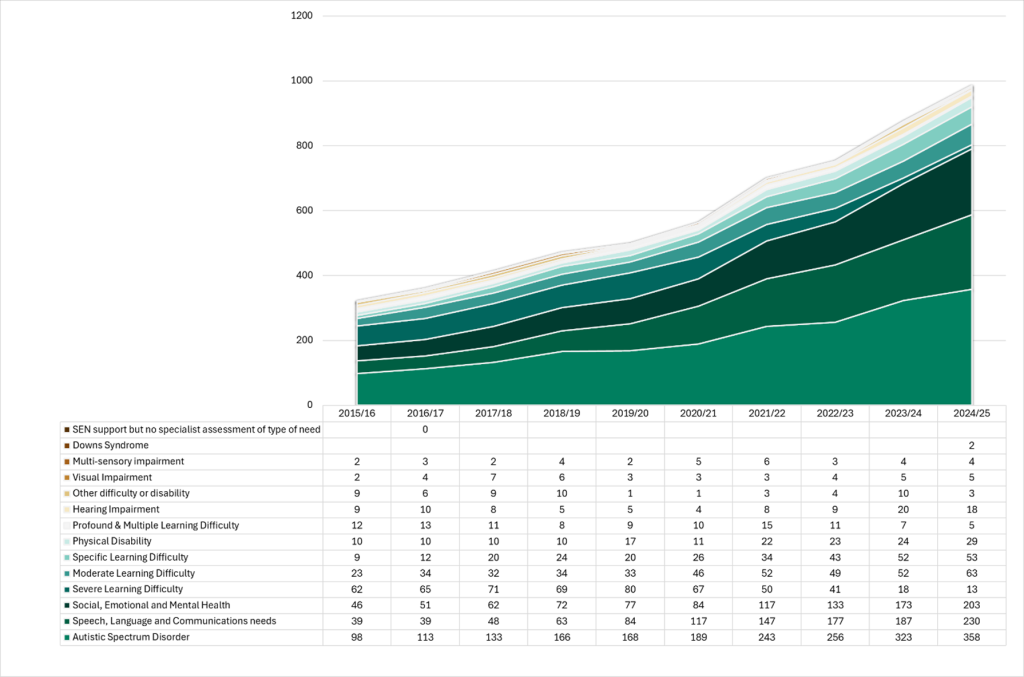
Figure 8: Trend in the number of local children on SEN support by primary need in Key Stage 2, 2015/16-2024/25
Key Stage 3 (Years 7-9)
In 2024/25, 2,239 local children were identified with SEND at KS3, 801 with an EHC plan in place and 1,438 receiving SEN Support. As summarised in Table 12 below, for EHC Plans the numbers by some primary needs are small but the proportions are comparable to/below regional and national averages. Notable exceptions are Severe Learning Difficulties, with local proportions above regional/national averages and Speech, Language and Communication needs with proportions below regional and national levels. For SEN support, the numbers of children at KS3 with some primary needs are small but similar to regional/national averages. Notable differences are higher local proportions with Physical Disabilities and Visual Impairments compared to the regional/national average.
Table 12 Primary need for state-funded Key Stage 3 by SEN provision in Central Bedfordshire, East of England and England in 2024/25
| Primary need | CBC EHC plan (number) | CBC EHC (%) | East of England EHC (%) | England EHC (%) | CBC SEN support (without EHC plan) (number) | CBC SEN (%) | East of England SEN (%) | England SEN (%) |
|---|---|---|---|---|---|---|---|---|
| Autistic Spectrum Disorder | 269 | 25.1 | 25.3 | 25.8 | 188 | 30.7 | 29.5 | 30.5 |
| Downs Syndrome | 1 | 6.3 | 13.0 | 14.9 | 0 | 0.0 | 4.2 | 0.4 |
| Hearing Impairment | 6 | 15.0 | 26.4 | 28.1 | 16 | 20.8 | 26.1 | 25.0 |
| Moderate Learning Difficulty | 77 | 32.2 | 37.5 | 36.3 | 191 | 22.7 | 24.5 | 27.2 |
| Multi-sensory impairment | 2 | 11.8 | 25.4 | 27.4 | 2 | 12.5 | 26.3 | 23.9 |
| Other difficulty or disability | 8 | 33.3 | 26.9 | 30.3 | 10 | 28.6 | 28.4 | 30.6 |
| Physical Disability | 22.0 | 25.3 | 25.9 | 26.0 | 44 | 37.3 | 24.7 | 25.0 |
| Profound & Multiple Learning Difficulty | 6 | 28.6 | 21.5 | 20.2 | 1 | 16.7 | 7.7 | 19.0 |
| SEN support but no specialist assessment of type of need | n/a | n/a | n/a | n/a | 27 | 39.1 | 17.8 | 19.3 |
| Severe Learning Difficulty | 22 | 32.8 | 24.7 | 23.9 | no data | no data | 12.3 | 21.0 |
| Social, Emotional and Mental Health | 219 | 33.3 | 36.6 | 34.4 | 477 | 27.6 | 27.5 | 27.8 |
| Specific Learning Difficulty | 69 | 37.9 | 36.4 | 36.7 | 367 | 36.4 | 33.0 | 34.5 |
| Speech, Language and Communications needs | 97 | 15.5 | 20.8 | 19.4 | 97 | 8.8 | 11.5 | 11.7 |
| Visual Impairment | 3 | 15.0 | 26.7 | 28.7 | 18 | 36.0 | 27.5 | 28.2 |
| Total | 801 | 1438 |
Further analysis for KS 3 children on EHC Plans is summarised in Figure 9 below. Whilst the numbers are small for many needs, as at KS1 and KS2 there are more children with Social, Emotional and Mental Health needs and Autistic Spectrum Conditions. More children with Speech, Language and Communication needs and Specific Learning Difficulties are also reported, though, as at KS2, the last year has seen a decrease in Severe Learning Difficulties. Similar analysis for KS3 children on SEN Support is summarised in Figure 10 below. The numbers are small for some primary needs and remain steady. For Moderate Learning Difficulties and Autistic Spectrum Conditions the numbers are high but decreasing. Recent data also reports increases in Speech, Language and Communication needs, Specific Learning Difficulties and Social, Emotional and Mental Health needs.
Figure 9: The number of children on EHC Plan by primary need in Key Stage 3, 2015/16-2024/25
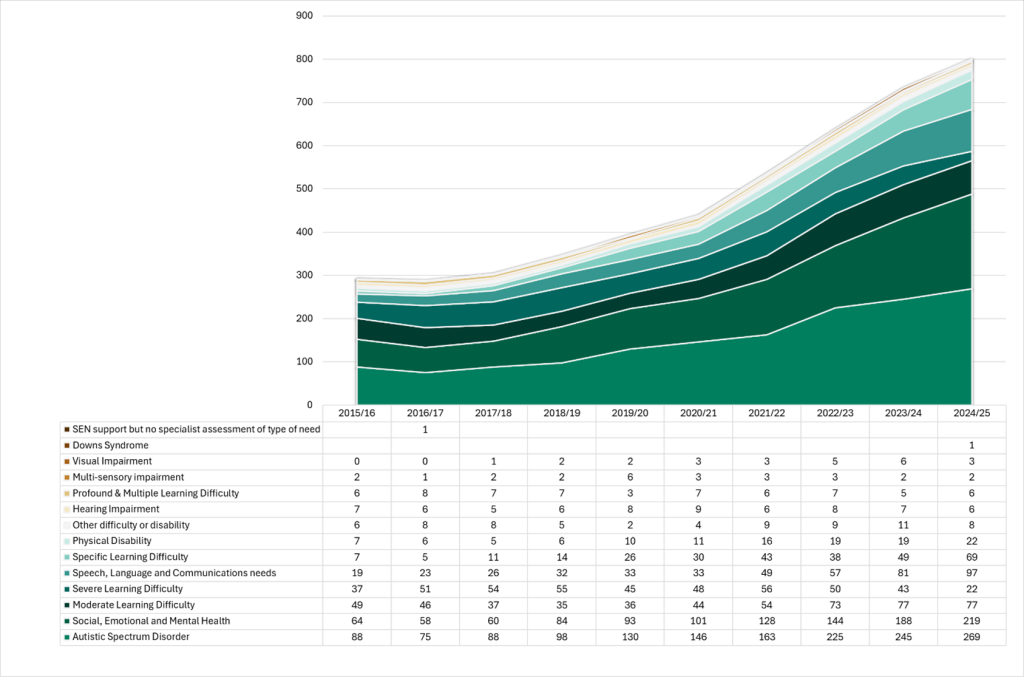
Figure 10 Trend in the number of local children on SEN support by primary need in Key Stage 3, 2015/16-2024/2
Key Stage 4 (Years 10-11)
In 2024/25, the number of local children identified with SEND at KS4 was 1,239, with 500 with an EHC plan and 739 children receiving SEN Support. As in Table 13 below, for those on EHC Plans the numbers of children by some primary needs are relatively small but the proportions are comparable to or below regional/national averages. Notable exceptions are Autistic Spectrum Disorders at levels above the regional/national average, whilst Speech, Language and Communication Needs proportions are below regional/national averages. For SEN support, the numbers at KS4 with some primary needs are relatively small but at levels similar to regional/national averages. One notable exception was Moderate Learning Difficulties, a need with a lower proportion than regional/national averages.
Table 13: Primary need for state-funded Key Stage 4 by SEN provision in Central Bedfordshire, East of England and England in 2024/25
| Primary need | CBC EHC plan (number) | CBC EHC (%) | East of England EHC (%) | England EHC (%) | CBC SEN support (without EHC plan) (number) | CBC SEN (%) | East of England SEN (%) | England SEN (%) |
|---|---|---|---|---|---|---|---|---|
| Autistic Spectrum Disorder | 187 | 17.4 | 14.7 | 15.1 | 104 | 17.0 | 16.7 | 18.2 |
| Downs Syndrome | 3 | 18.8 | 7.0 | 4.7 | 0 | 0.0 | 0.0 | 0.0 |
| Hearing Impairment | 6 | 15.0 | 19.4 | 17.9 | 14 | 18.2 | 16.2 | 17.1 |
| Moderate Learning Difficulty | 57 | 23.8 | 22.5 | 23.3 | 61 | 7.3 | 13.1 | 15.2 |
| Multi-sensory impairment | 2 | 11.8 | 14.4 | 14.9 | 1 | 6.3 | 11.4 | 14.9 |
| Other difficulty or disability | 7 | 29.2 | 21.7 | 20.3 | 9 | 25.7 | 17.3 | 19.3 |
| Physical Disability | 12 | 13.8 | 16.7 | 17.0 | 13 | 11.0 | 17.0 | 16.7 |
| Profound & Multiple Learning Difficulty | 3 | 14.3 | 12.4 | 13.4 | 1 | 16.7 | 13.8 | 8.6 |
| SEN support but no specialist assessment of type of need | n/a | n/a | n/a | n/a | 5 | 7.2 | 6.4 | 8.6 |
| Severe Learning Difficulty | 9 | 13.4 | 14.9 | 16.3 | no data | no data | 10.1 | 10.7 |
| Social, Emotional and Mental Health | 142 | 21.6 | 22.5 | 24.2 | 283 | 16.4 | 17.7 | 18.5 |
| Specific Learning Difficulty | 32 | 17.6 | 20.4 | 20.1 | 208 | 20.7 | 22.3 | 22.1 |
| Speech, Language and Communications needs | 34 | 5.4 | 10.9 | 10.1 | 30 | 2.7 | 5.4 | 5.7 |
| Visual Impairment | 6 | 30.0 | 18.2 | 19.6 | 10 | 20.0 | 17.5 | 18.7 |
| Total | 500 | 739 |
Further analysis for KS4 children and young people on EHC Plans is summarised in Figure 11 below. Whilst the numbers are small for many needs, increasing numbers of children with Social, Emotional and Mental Health needs and Autistic Spectrum Conditions are clear. Further data analysis for KS4 children on SEN Support is summarised in Figure 12 below. The numbers are small for some primary needs and remain steady. The numbers of children with Moderate Learning Difficulties are higher but have continued to decrease in the last few years. However, the numbers with Autistic Spectrum Conditions and Social, Emotional and Mental Health continue to increase, whilst numbers with Specific Learning Difficulties remain high but steady.
Figure 11: The number of children on EHC Plan by primary need in Key Stage 4, 2015/16-2024/25
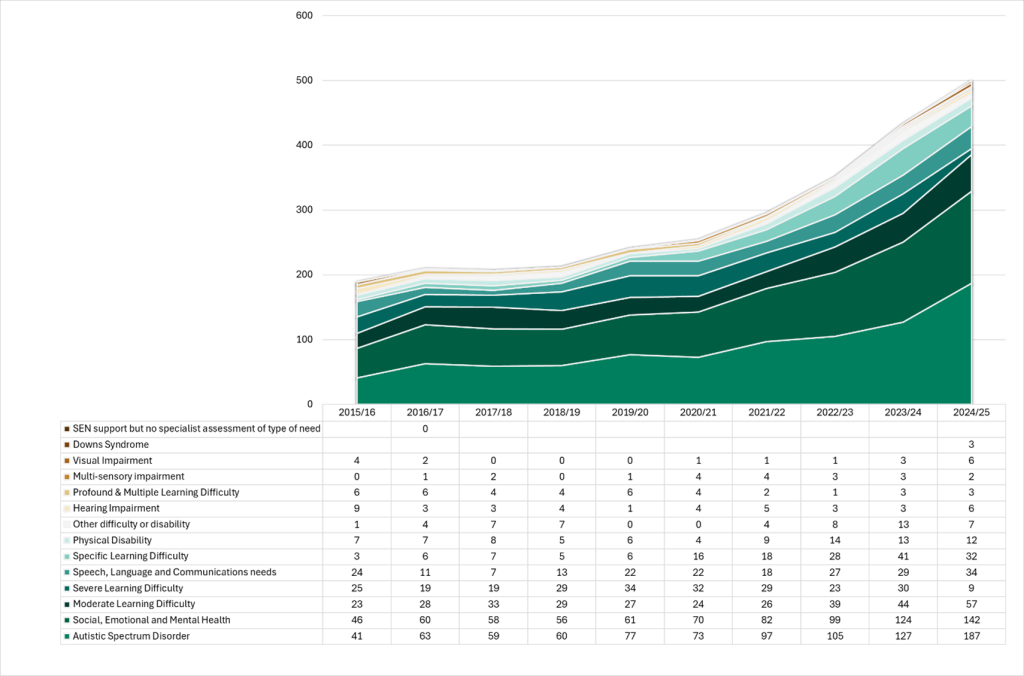
(Note: blank cell = no data available)
Figure 12: Trend in the number of local children on SEN support by primary need in Key Stage 4, 2015/16-2024/25
(Note: blank cell = no data available)
College Years (Years 12-14)
In 2024/25, there were 284 young people receiving SEND provision in years 12 to 14 in Central Bedfordshire, of whom 183 had an EHC plan in place and 101 were receiving SEN Support. As summarised in Table 14 below, for those on EHC Plans the numbers of young people by some primary needs are relatively small but the proportions are often similar to regional and national averages. Two exceptions are the proportions of young people with Social, Emotional and Mental Health needs and Severe Learning Difficulties, which both remain above the regional/national average. For SEN support, the numbers of young people in College years/transition with primary needs remains small but at levels similar to or below regional/national averages.
Table 14: Primary need for College Years and transition young people by SEN provision in Central Bedfordshire, East of England and England in 2024/25
| Primary need | CBC EHC plan (number) | CBC EHC (%) | East of England EHC (%) | England EHC (%) | CBC SEN support (without EHC plan) (number) | CBC SEN (%) | East of England SEN (%) | England SEN (%) |
|---|---|---|---|---|---|---|---|---|
| Autistic Spectrum Disorder | 67 | 6.2 | 4.5 | 5.9 | 25 | 4.1 | 5.2 | 4.8 |
| Downs Syndrome | 0 | 0.0 | 5.0 | 4.4 | 0 | 0.0 | 0.0 | 0.4 |
| Hearing Impairment | 2 | 5.0 | 5.7 | 6.7 | 3 | 3.9 | 5.5 | 5.2 |
| Moderate Learning Difficulty | 22 | 9.2 | 6.8 | 7.1 | 2 | 0.2 | 1.5 | 1.5 |
| Multi-sensory impairment | 6 | 35.3 | 7.7 | 5.6 | 0 | 0.0 | 3.1 | 3.4 |
| Other difficulty or disability | 4 | 16.7 | 3.9 | 5.2 | 2 | 5.7 | 7.5 | 5.0 |
| Physical Disability | 4 | 4.6 | 7.9 | 7.9 | 3 | 2.5 | 5.1 | 4.9 |
| Profound & Multiple Learning Difficulty | 3 | 14.3 | 15.9 | 15.4 | 0 | 0.0 | 0.0 | 0.7 |
| SEN support but no specialist assessment of type of need | n/a | n/a | n/a | n/a | 1 | 1.4 | 0.8 | 1.7 |
| Severe Learning Difficulty | 18 | 26.9 | 13.0 | 15.7 | no data | no data | 1.7 | 1.7 |
| Social, Emotional and Mental Health | 33 | 5.0 | 1.9 | 2.4 | 29 | 1.7 | 2.6 | 2.4 |
| Specific Learning Difficulty | 10 | 5.5 | 3.8 | 4.0 | 26 | 2.6 | 5.3 | 4.9 |
| Speech, Language and Communications needs | 13 | 2.1 | 1.7 | 2.2 | 7 | 0.6 | 0.7 | 0.7 |
| Visual Impairment | 1.0 | 5.0 | 5.8 | 8.3 | 3.0 | 6.0 | 6.8 | 5.7 |
| Total | 183 | 101 |
Further analysis for young people in their College Years/transition on EHC Plans is summarised in Figure 13 below. Whilst the numbers are small across most primary needs, as at earlier Key Stages, the increasing numbers of young people with Social, Emotional and Mental Health needs and Autistic Spectrum Conditions are clear. The last two years have also seen the numbers with Moderate Learning Difficulties stabilise, whilst numbers of young people with Severe Learning Difficulties continue to reduce. Further analysis for those on SEN Support is summarised in Figure 14 below. The numbers are small for most primary needs and remain steady, with recent small increases in the numbers of young people with Social, Emotional and Mental Health Needs.
Figure 13: Trend in number of young people on EHC Plan by primary need in College Years/Transition, 2015/16-2024/25
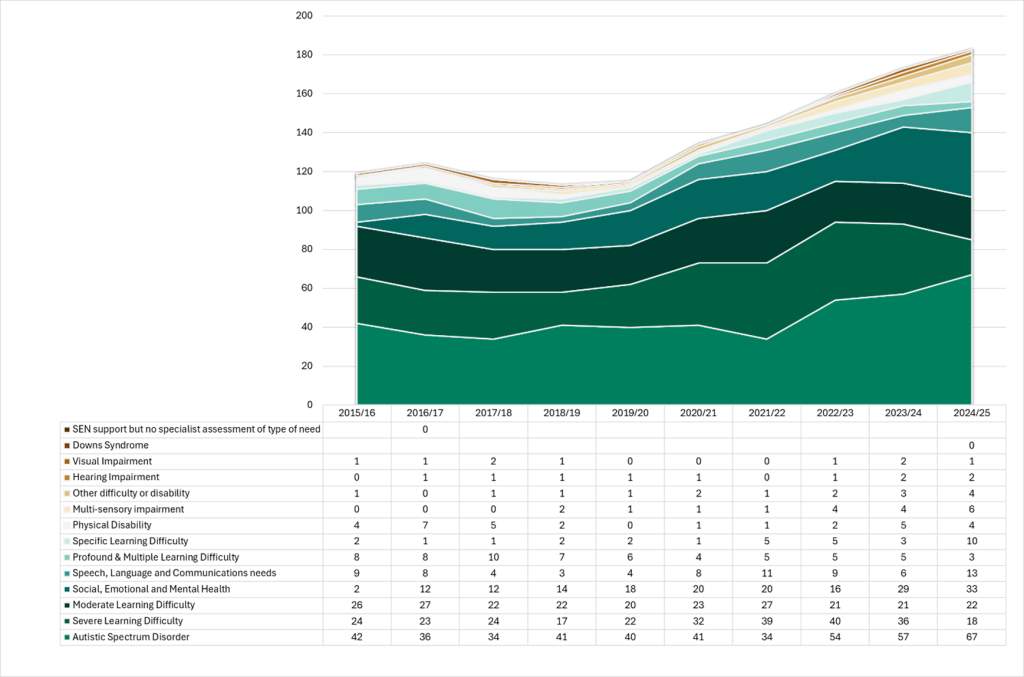
Figure 14: Trend in the number of young people on SEN support by primary need in College Years/transition, 2015/16-2024/25
References
[1] All state funded schools = state-funded nursery, primary, secondary and special schools, non-maintained special schools and state-funded alternative provision schools. It does not include independent schools