

Dashboard
Children & Young People (CYP) Dashboard
This Dashboard provides fast access to data analysis of the factors identified as important indicators for, or measures of the health and well-being of children and young people living in Central Bedfordshire. It features data and charts accompanied by explanatory text that highlights the most important trends and data points. The data is accurate as of July 2024 and is due to be refreshed in September 2025.
Format: This is a Power BI dashboard, which enables you to interrogate the data and charts specifically to your needs. See instructions below for how to get started.
How to use the Dashboard
This Dashboard is delivered in an interactive Power BI version that will enable you to interrogate the data and download data and charts specific to your needs. You can:
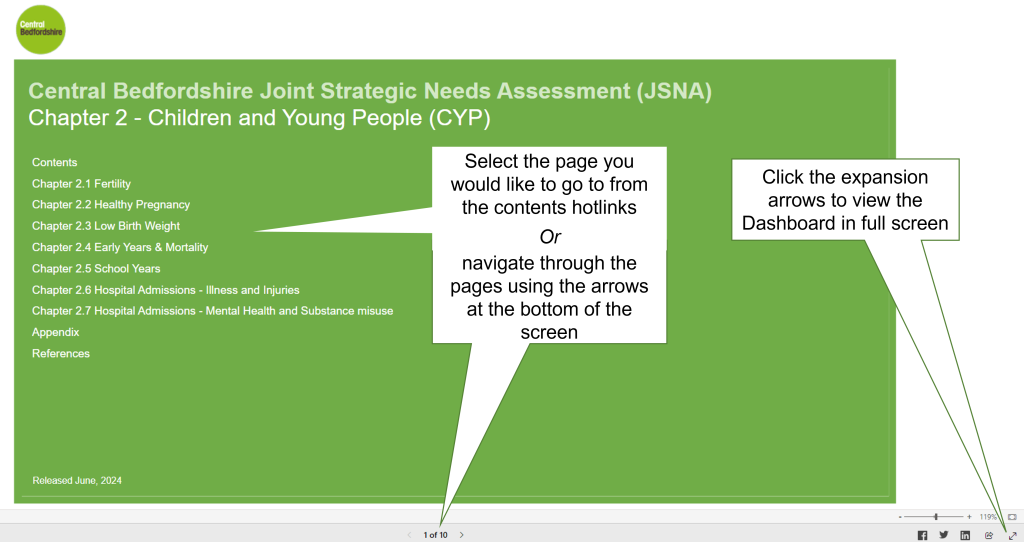
- Navigate around the pages in the Dashboard by clicking on the contents hotlinks or the page number at the bottom of the screen, which reveals the page menu or by clicking on the arrows
- Display the Dashboard in full screen mode by clicking the expansion arrows in the bottom right corner
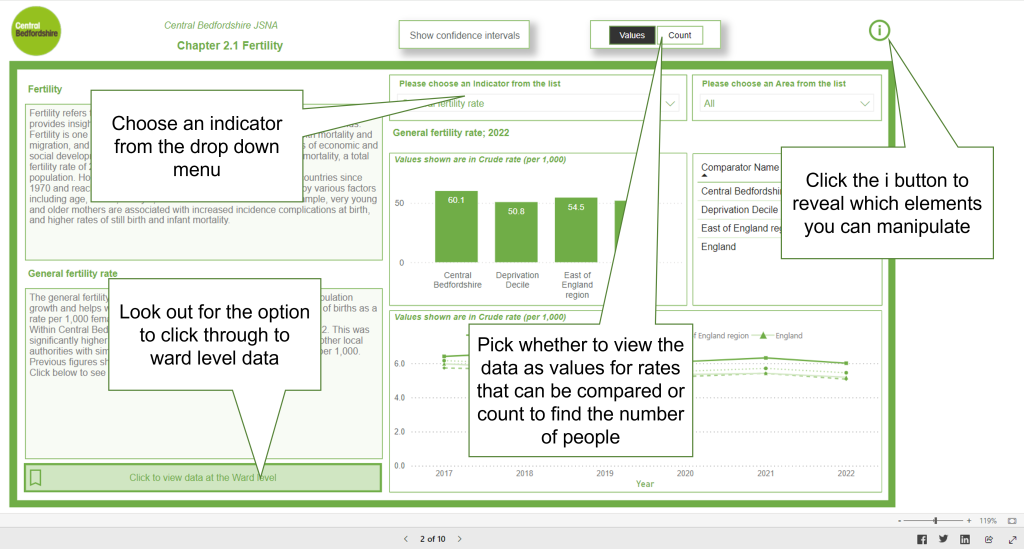
- Identify which elements you can manipulate by clicking on the i button in the top right corner
- Choose from multiple indicators on the same page from the drop down list
- Choose between values for rates that can be compared to other areas and the raw numbers
- Find how to click through to ward level data for some indicators
Use of comparators: For all the data presented in this Dashboard, comparators are provided to add context to the values shown for Central Bedfordshire. In all cases an overall average for England is shown and, wherever possible, values for the Deprivation Decile are also provided. This allows for comparison with other local authorities with similar levels of deprivation. If data is not available for the Deprivation Decile, Regional values are shown instead.
Please note: There are two major changes that took place in 2023 that affect the underlying data parameters used in these Dashboards. They are as follows:
- 2021 Census: Population data and population predictions are being re-calculated based the information from the 2021 Census. To date, the population data has been recalculated at national and local authority levels but not yet at ward level. Wards are still being calculated based on the 2011 Census and therefore ward totals will not add up to the local authority total
- 2023 Ward and Ward Boundaries: There were a number of changes to Ward boundaries in 2023 and new wards created. These are not yet reflected in the data in the Dashboard, which relates to periods before the changes were made
Statistical significance: The term significant or significantly is used throughout this Dashboard. It relates to statistical significance. This means that if a difference or change is identified as significant, the probability of it occurring by chance is less than 5%.