

Learning Disabilities Data Dashboard
Learning Disabilities Data Dashboard
This Dashboard provides fast access to data analysis of the factors identified as important indicators for, or measures of the health and well-being of people with Learning Disabilities aged 19 and over living in Central Bedfordshire. It also includes projections of the prevalence of Learning Disabilities among the adult population from POPPI and PANSI. The Dashboard features data and charts accompanied by explanatory text that highlights the most important trends and data points. The data is accurate as of July 2024. See instructions below for how to get started.
How to use the Dashboard
This Dashboard is delivered in an interactive Power BI version that will enable you to interrogate the data and charts according to your needs. You can:
- Navigate around the pages in the Dashboard by clicking on the contents hotlinks or the page number at the bottom of the screen, which reveals the page menu or by clicking on the arrows
- Display the Dashboard in full screen mode by clicking the expansion arrows in the bottom right corner
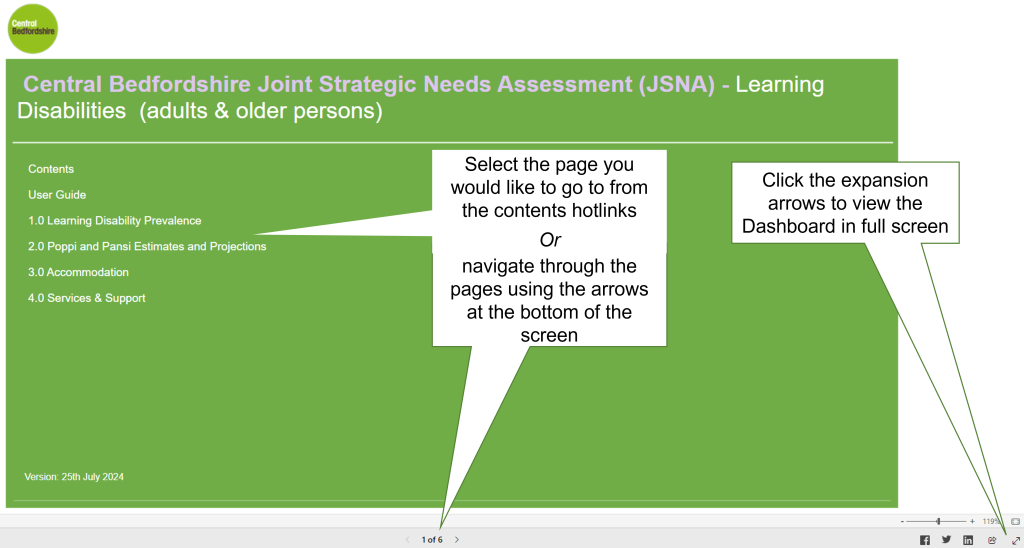
- Identify which elements you can manipulate by clicking on the i button in the top right corner
- Choose from multiple indicators on the same page from the drop down list
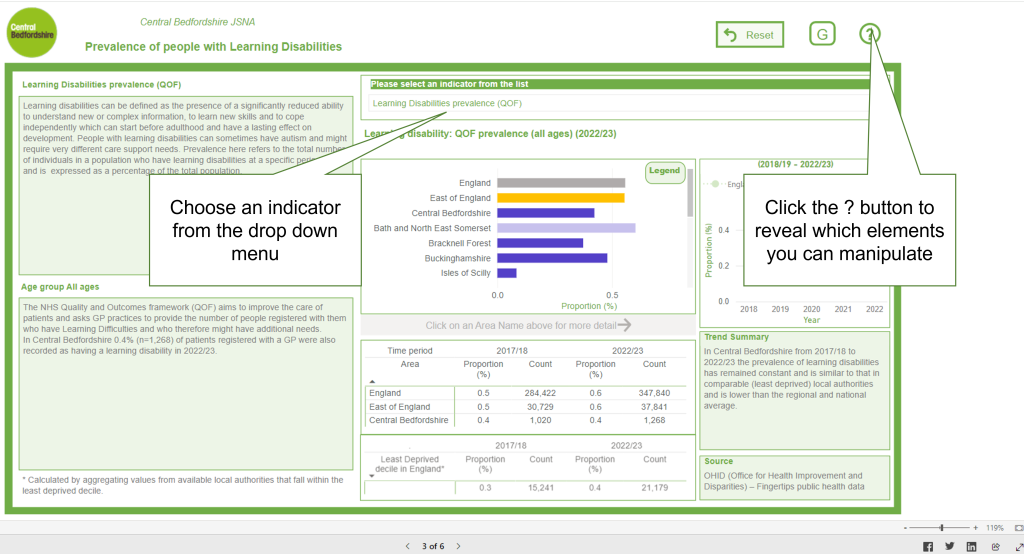
Use of comparators: For all the data presented in this Dashboard, comparators are provided to add context to the values shown for Central Bedfordshire. In all cases an overall average for England is shown and, wherever possible, values for the Deprivation Decile are also provided. This allows for comparison with other local authorities with similar levels of deprivation. If data is not available for the Deprivation Decile, Regional values are shown instead.
Statistical significance: The term significant or significantly is used throughout this Dashboard. It relates to statistical significance. This means that if a difference or change is identified as significant, the probability of it occurring by chance is less than 5%.