
Indices of Deprivation 2025
Indices of Deprivation (IoD) 2025
The indices of Deprivation (IoD) was updated at the end of October 2025. The Dashboard below provides a detailed analysis of the relative position of Central Bedfordshire across each of the seven Index of Multiple Deprivation (IMD) Domains of Deprivation, as well as for the IMD overall, and for Income Deprivation Affecting Children (IDACI) and Income Deprivation Affecting Older People (IDAOPI). The analysis includes: change from previous IMD report (2015 and 2019), neighbour comparisons (CIPFA, CSSNBT, Deprivation Decile and Region), smaller geographies including weighted ward averages and LSOAs, and a postcode lookup.
Below the Dashboard is a Summary of the outcomes of IMD 2025 for Central Bedfordshire, which can also be downloaded at the bottom of the page.
Dashboard
How to use the Dashboard
The video below will take you through the features and functions of the Dashboard and how to use them.
Central Bedfordshire Local Authority IMD 2025 Summary
Overview
The Indices of Deprivation 2025 (IMD 2025) ranks Central Bedfordshire as the 134th most deprived local authority out of 153 upper-tier local authorities in England on the overall Rank of Average Score measure. This represents a relatively stable position compared to the IMD 2019 results, when the council was ranked 137th most deprived out of 151 authorities.
What Does Moving from 137 → 134 Mean?
- Central Bedfordshire moved down three places (from 137th to 134th), but:
- The total number of authorities increased from 151 to 153.
- The change is small, so Central Bedfordshire’s overall deprivation level is broadly stable relative to other local authorities.
- IMD is relative (not absolute), so this shift could mean:
- Conditions in Central Bedfordshire worsened slightly compared to other areas, or
- Other local authorities have improved, making Central Bedfordshire look relatively more deprived.
Key Interpretation
Central Bedfordshire is ranked within decile 9 in 2025, which is the second least deprived decile of local authorities nationally. This represents a change compared to 2019, when it ranked in decile 10, the least deprived decile.
IMD Domains
The Index of Multiple Deprivation (IMD) is made up of 7 standalone indices (see Table 1). Each index represents a different aspect of deprivation, and the domains are combined using a weighted system. The weighting reflects the relative importance of each domain in determining overall deprivation.
There are two supplementary indices, Income Deprivation Affecting Children (IDACI) and Income Deprivation Affecting Older People (IDAOPI). IDACI is a ranking of the proportion of children under 16 living in income deprived families, and IDAOPI is a ranking of the proportion of people aged 60 and over who are income deprived.
Table 1: Rank of each domain and supplementary index (2025 vs 2019)
(↑ = improved ranking; ↓ = worsened ranking)
| Domain (weight) | 2025 Rank | Change since 2019 |
|---|---|---|
| Health (13.5%) | 128 | ↓ 4 |
| Education (13.5%) | 101 | ↓ 4 |
| Employment (22.5%) | 137 | ↓ 1 |
| Housing (9.3%) | 57 | ↓ 24 |
| Income (22.5%) | 132 | ↓ 5 |
| Crime (9.3%) | 127 | ↑ 11 |
| Living Environment (9.3%) | 148 | ↑ 28 |
| Domain | 2025 Rank | Change since 2019 |
|---|---|---|
| IDACI (Income Deprivation Affecting Children) | 130 | ↑ 2 |
| IDAOPI (Income Deprivation Affecting Older People) | 136 | ↓ 2 |
Most of the changes to individual domains were small, however there was a marked increase in housing deprivation and a marked decrease in deprivation relating to living environment and crime, relative to other areas.
The supplementary indices show only small changes in income deprivation affecting children and older adults.
Lower Super Output Areas (LSOAs)
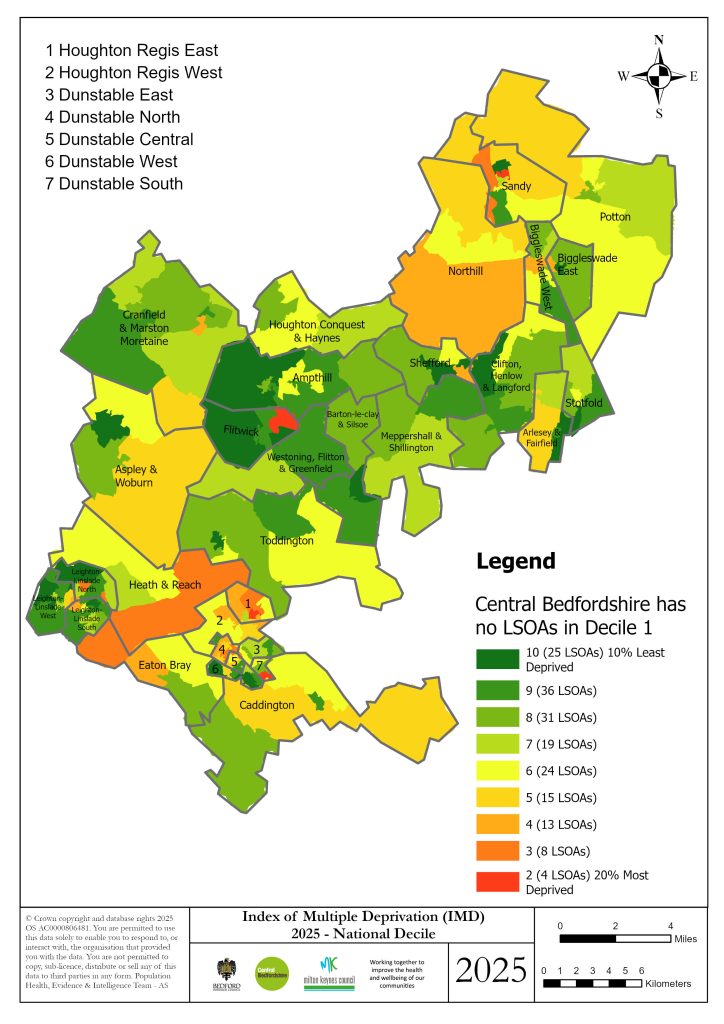
Within Central Bedfordshire, there is variation in deprivation levels across the area, with pockets of marked deprivation concentrated in the Dunstable South, Houghton Regis East and Flitwick wards (see Figure 1).
Overall, no LSOAs fall within the most deprived 10% nationally and this has not changed since 2019. Twenty-five LSOAs are among the least deprived 10% nationally. The total number of LSOAs increased by 18 between the 2019 and 2025 data releases.
Note: The Indices of Deprivation 2025 has been produced using updated datasets, methodologies, and geographical boundaries. As a result, its outputs are not directly comparable with those from previous years. Users should avoid comparing areas over time and instead consider each area’s relative position within the national context at this single point in time.
Figure 1: Index of Multiple Deprivation 2025 – LSOA Map