

Dashboard
Living and Working Well Dashboard
This Dashboard provides fast access to data analysis of the factors identified as important indicators for, or measures of the health and well-being of working age people living in Central Bedfordshire. It features data and charts accompanied by explanatory text that highlights the most important trends and data points. The data is accurate as of April 2024.
Format: This is a Power BI dashboard, which enables you to interrogate the data and charts according to your needs. See instructions below for how to get started.
How to use the Dashboard
This Dashboard is delivered in an interactive Power BI version that will enable you to interrogate the data and download data and charts specific to your needs. You can:
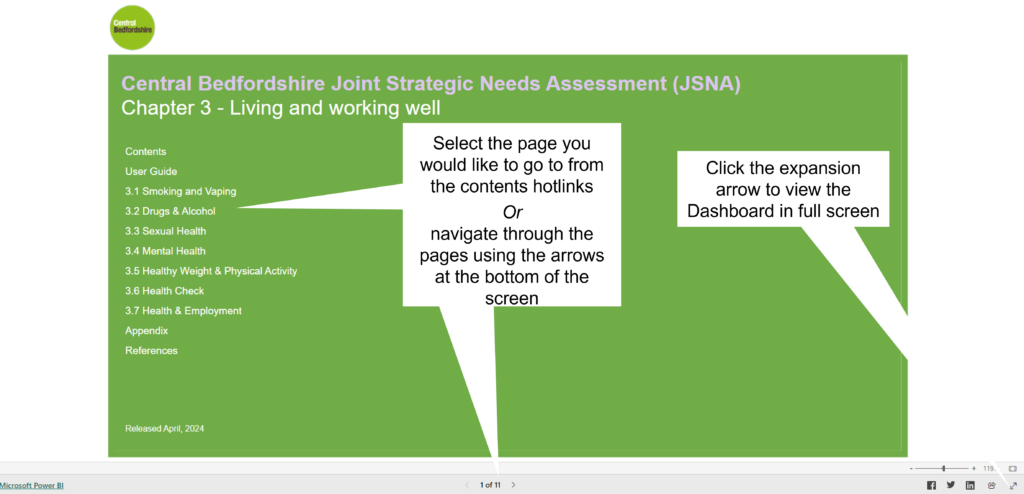
- Navigate around the pages in the Dashboard by clicking on the contents hotlinks or the page number at the bottom of the screen, which reveals the page menu or by clicking on the arrows
- Display the Dashboard in full screen mode by clicking the expansion arrows in the bottom right corner
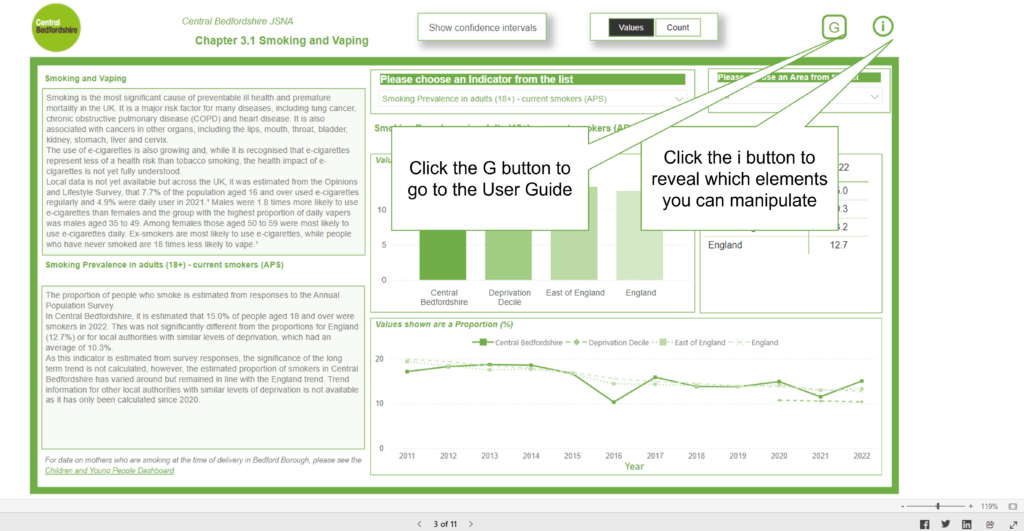
- Learn about the functionality of this Dashboard specific Dashboard with the User Guide
- Identify which elements you can manipulate by clicking on the i button in the top right corner
Use of comparators: For all the data presented in this Dashboard, comparators are provided to add context to the values shown for Central Bedfordshire. In all cases an overall average for England is shown and, wherever possible, values for the Deprivation Decile are also provided. This allows for comparison with other local authorities with similar levels of deprivation. If data is not available for the Deprivation Decile, Regional values are shown instead.
Please note: The National and Council data reflect the 2021 Census. Ward level data from the 2021 Census is not yet available and therefore these profiles use the 2011 Census estimates. Therefore the sum of wards does not equal the Central Bedfordshire total. These profiles will be updated as and when the data becomes available.
Interrogate nationally available data
Most of the data featured in the Dashboard are available through Fingertips, the Public Health data tool provided by the Office for Health Improvement & Disparities. Each link will take you to the trend data for Central Bedfordshire for that indicator and will open in a new window. You can then chose what other views you would like including by comparator areas and inequalities. For more information on how to use Fingertips, see the user guide.
Smoking
Smoking Prevalence in adults (18+) – current smokers (APS)
Smoking prevalence in adults in routine and manual occupations (18-64) – current smokers (APS)
Smokers who have successfully quit at 4 weeks and those that are CO verified
Smoking attributable hospital admissions (new method)
Smoking prevalence in adults (18+) with serious mental illness (SMI) (Data for 2015 only)
Drug and alcohol use
Admission episodes for alcohol specific conditions (Persons)
Number in treatment at specialist alcohol misuse services
Proportion waiting more than 3 weeks for alcohol treatment
Sexual health
Chlamydia diagnostic rate per 100,000 aged 25 years and older
Chlamydia proportion aged 15 to 24 screened
HIV late diagnosis in people first diagnosed with HIV in the UK
Mental health
Emergency hospital admissions for intentional self harm – standardised admission ratio
Depression: QOF prevalence (aged 18+)
Excess under 75 mortality rate in adults with severe mental illness (SMI)
Healthy weight and physical activity
Percentage of physically active adults
Percentage of adults (aged 18+) classified as overweight or obese
Utilisation of outdoor space for exercise/health reasons
Percentage of adults walking for travel at least three days per week
NHS health checks
People invited for an NHS Health Check per year
People taking up an NHS Health Check invite per year
People receiving an NHS Health Check per year